Fig. 5.
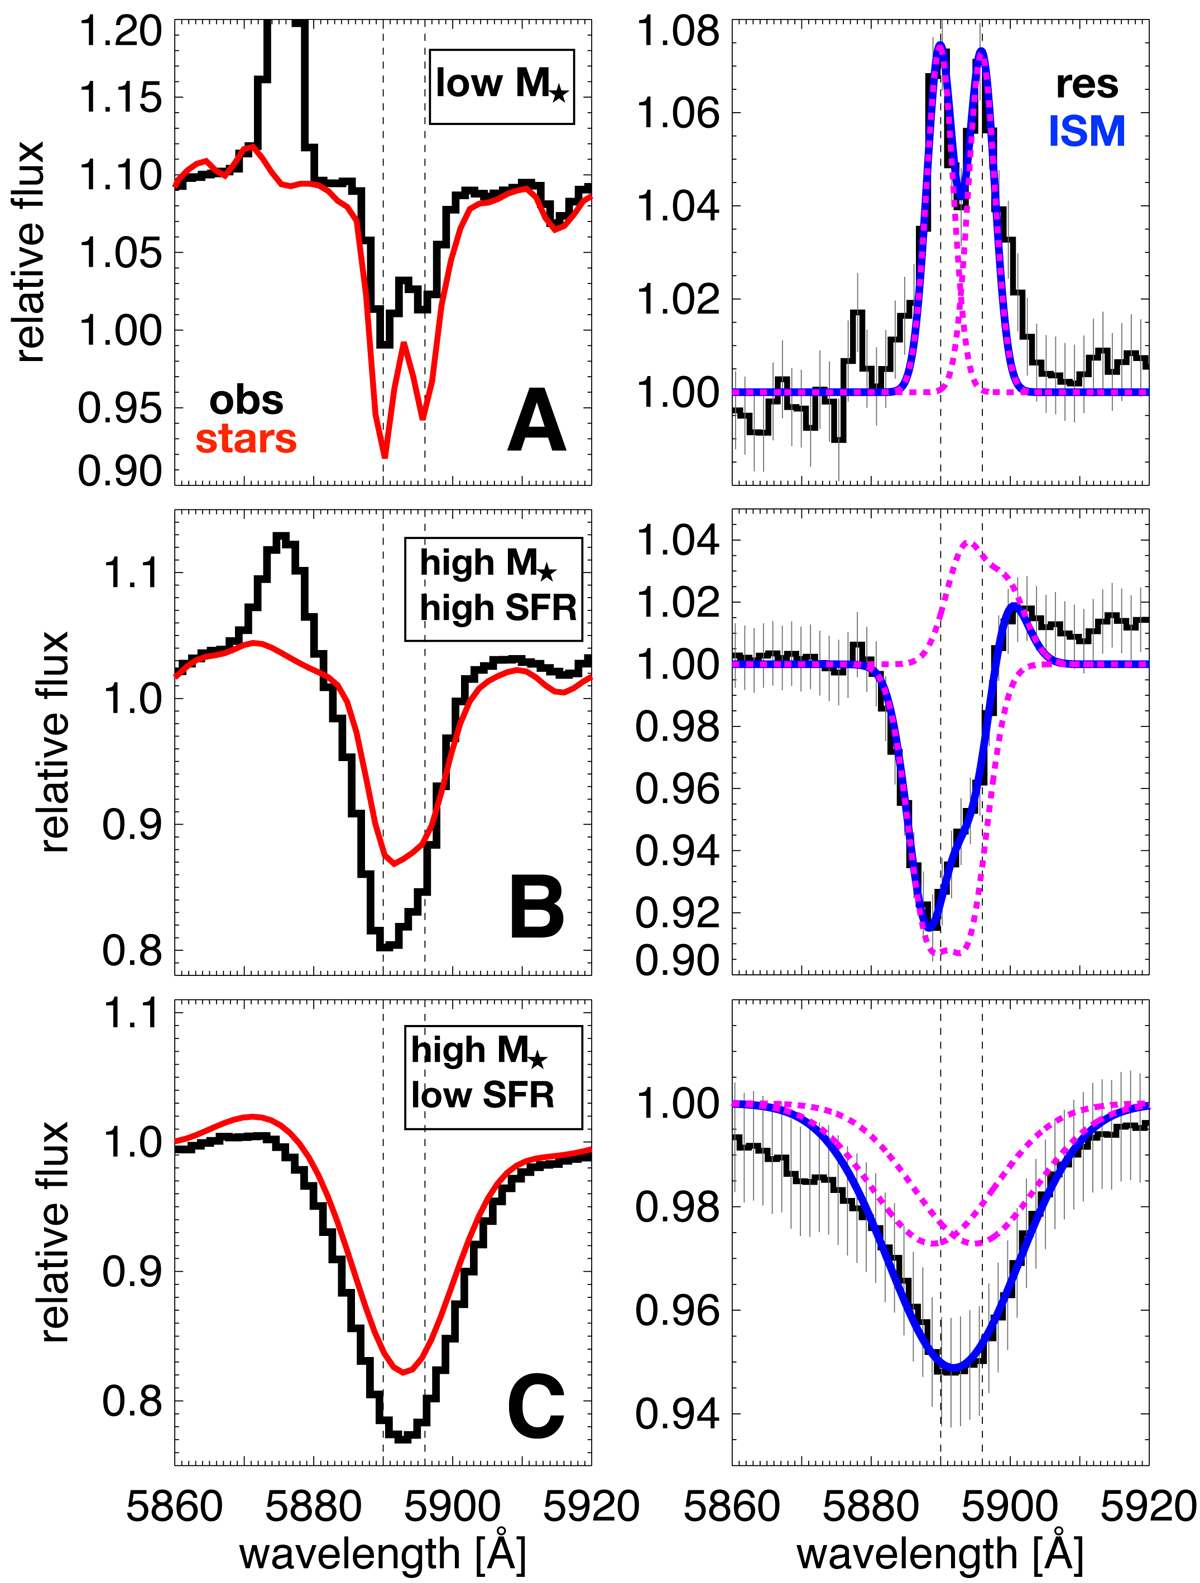
Examples of Na I D fits of the stacked spectra from three different regions of the SFR-M⋆ plane, labelled in Fig. 4: low stellar mass (log(M)⋆ < 10.5 M⊙, top panels, bin A in Fig. 5), high stellar mass and high SFR (log(M)⋆ > 10.5 M⊙ log(SFR) > 1.1 M⊙ yr−1, central panels, bin B in Fig. 5), and low SFR and high stellar mass (log(M)⋆ > 10.5 M⊙, log(SFR) < 0.5 M⊙ yr−1, bottom panels, Bin C in Fig. 5). The expected wavelengths of Na I D are shown as vertical dashed lines. Left panels: black histogram illustrates the observed stacked spectrum, the red line the best-fit stellar continuum. Right panels: black histogram shows the residual flux and errors after the stellar continuum has been removed. The best-fit of the doublet is shown in blue. The dotted magenta curves are the single-Gaussian components. Only in bin B (central panel) do we detect a Doppler blueshift of the Na I D absorption feature with ΔV = −102 ± 41 km s−1. In the other two bins the Na I D line shows a zero-velocity emission (bin A, top panel) and absorption (bin C, bottom panel) below the instrumental resolution 70 km s−1.
Current usage metrics show cumulative count of Article Views (full-text article views including HTML views, PDF and ePub downloads, according to the available data) and Abstracts Views on Vision4Press platform.
Data correspond to usage on the plateform after 2015. The current usage metrics is available 48-96 hours after online publication and is updated daily on week days.
Initial download of the metrics may take a while.