Fig. 2.
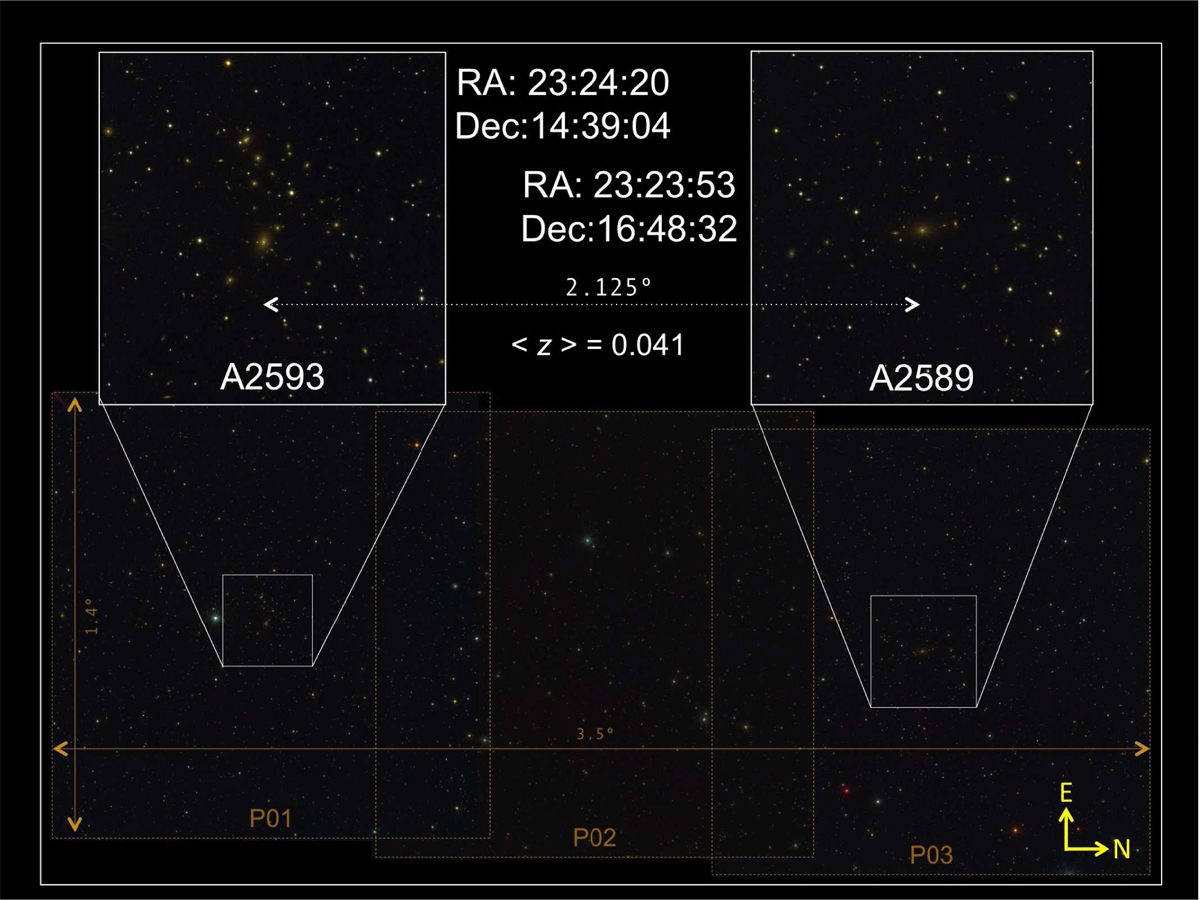
A2589 & A2593 galaxy clusters. The figure shows the final layout for the observations composed by three overlapping J-PLUS pointings, covering a total area of 3.5 × 1.4 deg2. Central coordinates for Pointing-1 and Pointing-3 (centered at the cluster BCGs) along with the physical separation among the clusters are indicated in the upper central region of the figure. This RGB color image has been created with the TRILOGY software (http://www.stsci.edu/dcoe/trilogy).
Current usage metrics show cumulative count of Article Views (full-text article views including HTML views, PDF and ePub downloads, according to the available data) and Abstracts Views on Vision4Press platform.
Data correspond to usage on the plateform after 2015. The current usage metrics is available 48-96 hours after online publication and is updated daily on week days.
Initial download of the metrics may take a while.