Fig. C.1.
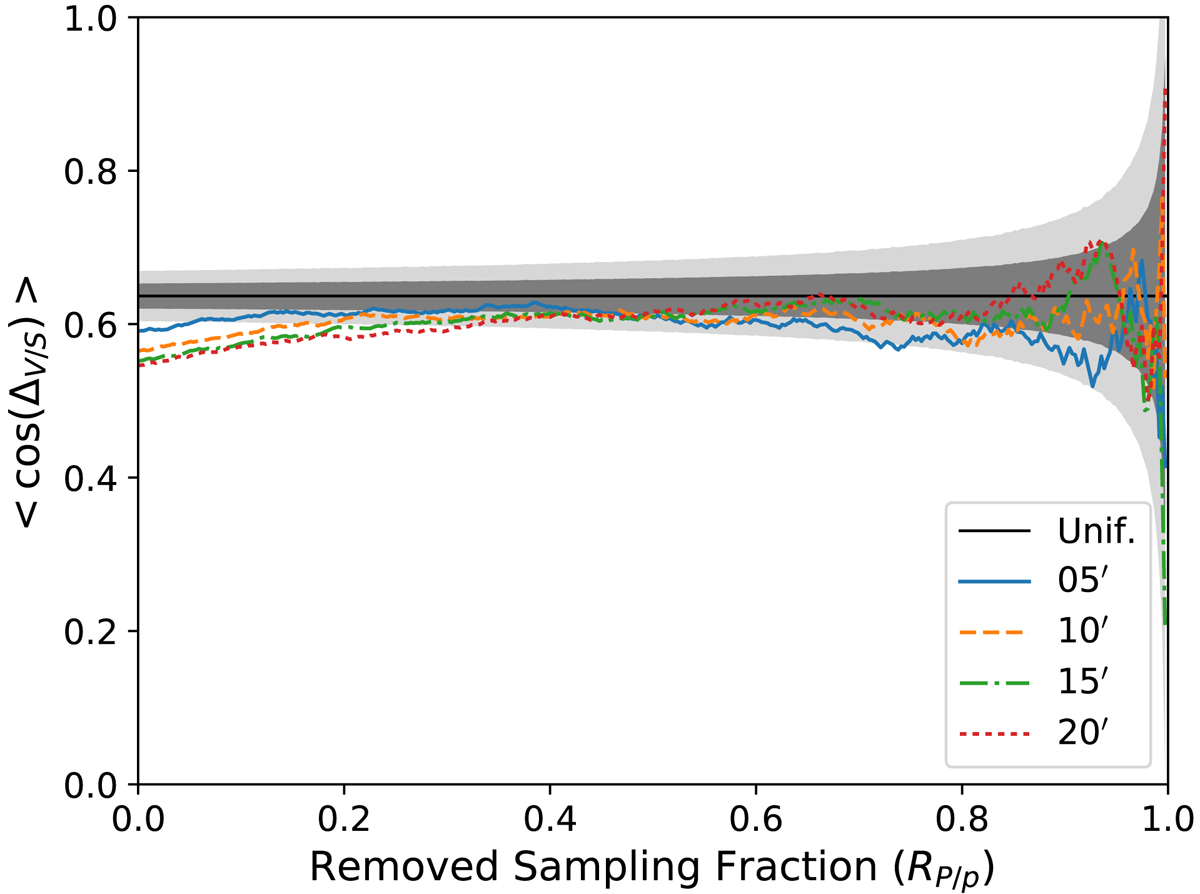
Gray shaded regions: one and two sigma deviations around the expected value (black horizontal line), assuming a uniform distribution of ΔS/V angles. The different lines refer to the different values of the FWHM used to evaluate the RP/p polarization ratio. They represent the ⟨cos(ΔS/V⟩ values from the data as a function of the fraction of the sample that is gradually removed while decreasing the RP/p selection threshold.
Current usage metrics show cumulative count of Article Views (full-text article views including HTML views, PDF and ePub downloads, according to the available data) and Abstracts Views on Vision4Press platform.
Data correspond to usage on the plateform after 2015. The current usage metrics is available 48-96 hours after online publication and is updated daily on week days.
Initial download of the metrics may take a while.