Fig. B.1.
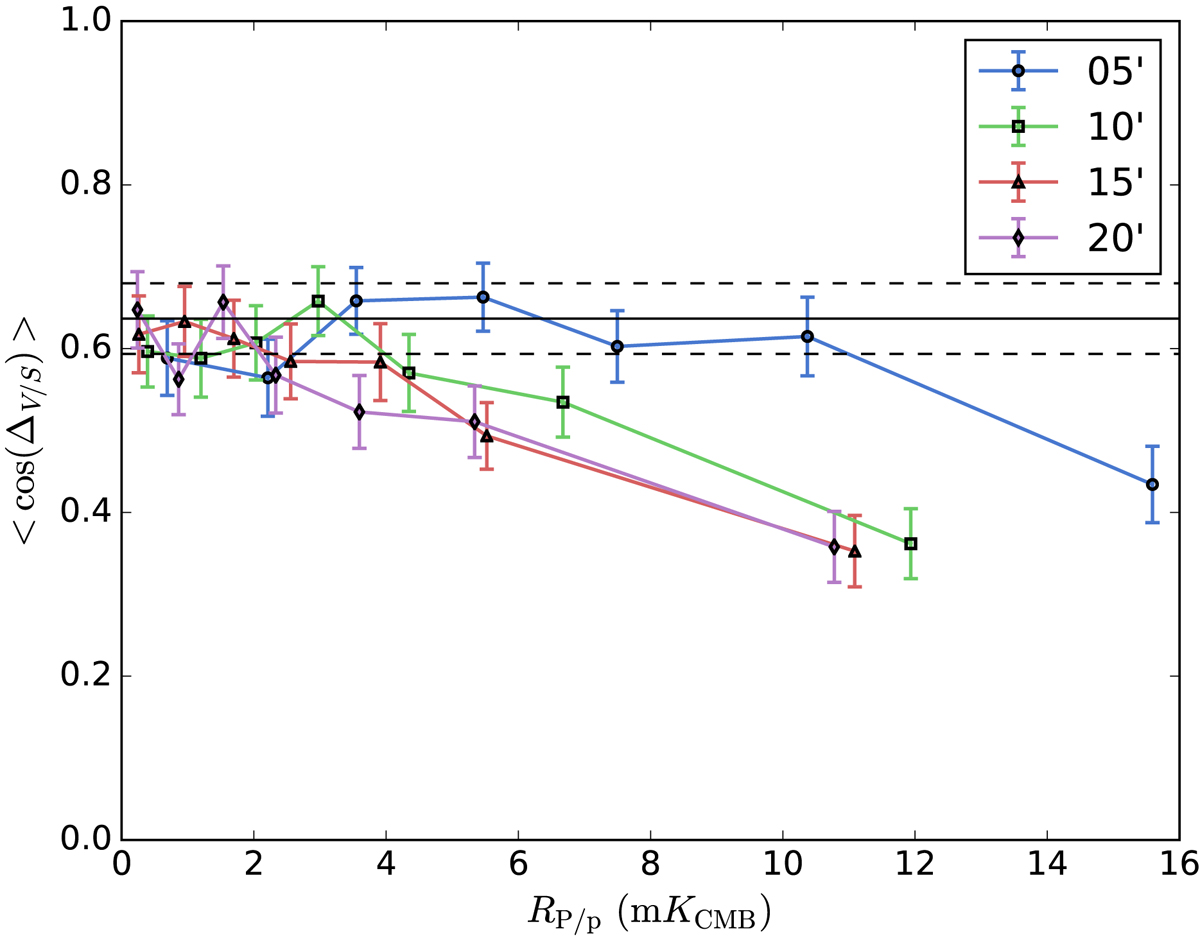
Same as for Fig. 3 but for different values of the smoothing of the maps. Error bars represent the sampling uncertainties in bins that we computed as the mean standard errors, i.e., the dispersion in bin divided by the square root of the number of data points in bin. The significant departure from uniformity in the last bin is observed for all tested FWHM values.
Current usage metrics show cumulative count of Article Views (full-text article views including HTML views, PDF and ePub downloads, according to the available data) and Abstracts Views on Vision4Press platform.
Data correspond to usage on the plateform after 2015. The current usage metrics is available 48-96 hours after online publication and is updated daily on week days.
Initial download of the metrics may take a while.