Fig. 6.
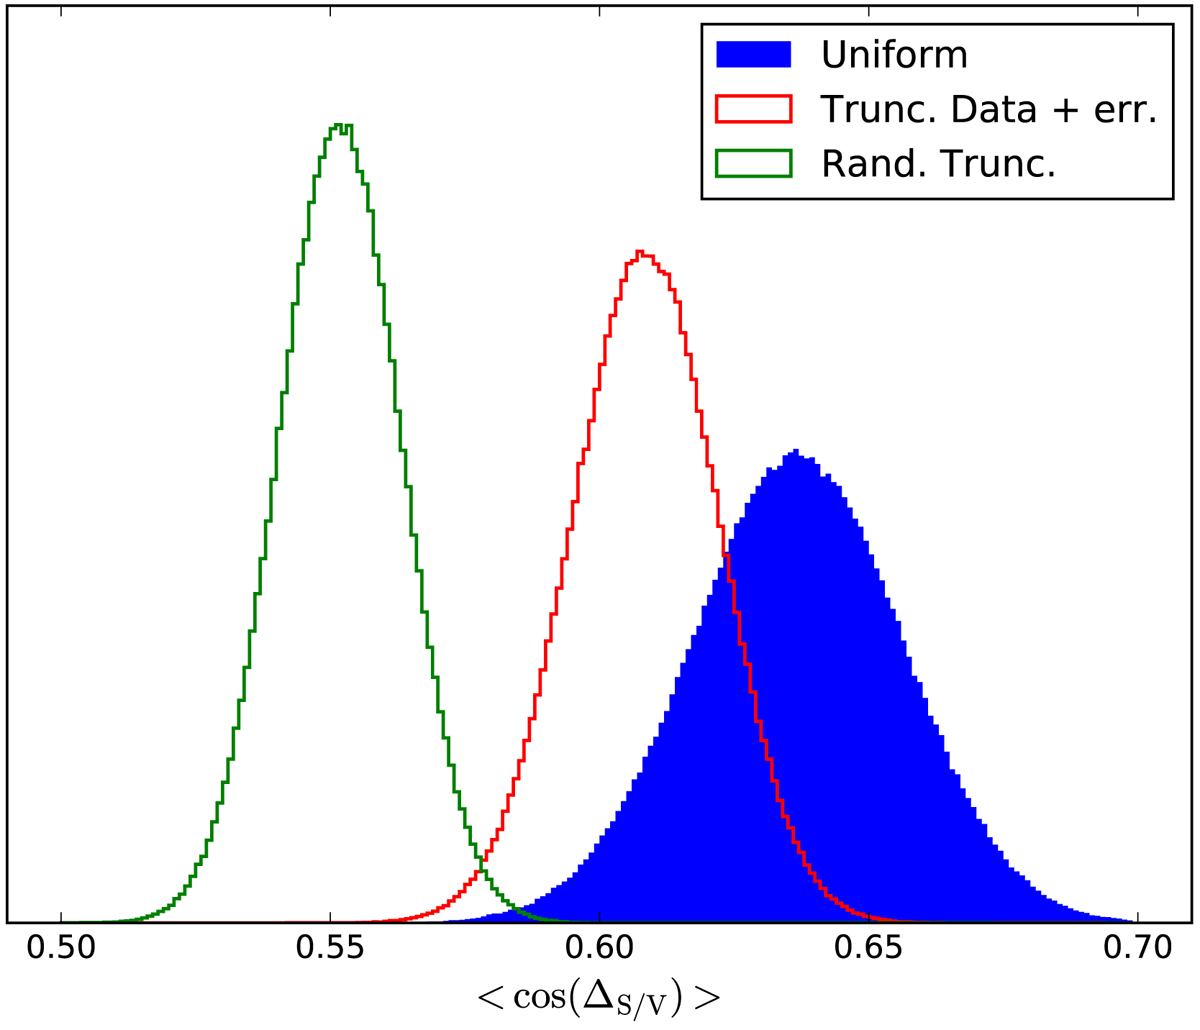
Filled blue histogram: distribution of ⟨cos(ΔS/V)⟩ for 106 realizations of uniform ΔS/V distributions for a sample size of 0.7 × 355. The red unfilled histogram corresponds to the values obtained for the data when removing the 30% of the sample with the higher values of the RP/p ratio. This distribution takes into account the errors on the polarization position angles. The green unfilled histogram shows 106 realizations of 30% random truncation of the original sample.
Current usage metrics show cumulative count of Article Views (full-text article views including HTML views, PDF and ePub downloads, according to the available data) and Abstracts Views on Vision4Press platform.
Data correspond to usage on the plateform after 2015. The current usage metrics is available 48-96 hours after online publication and is updated daily on week days.
Initial download of the metrics may take a while.