Fig. 5.
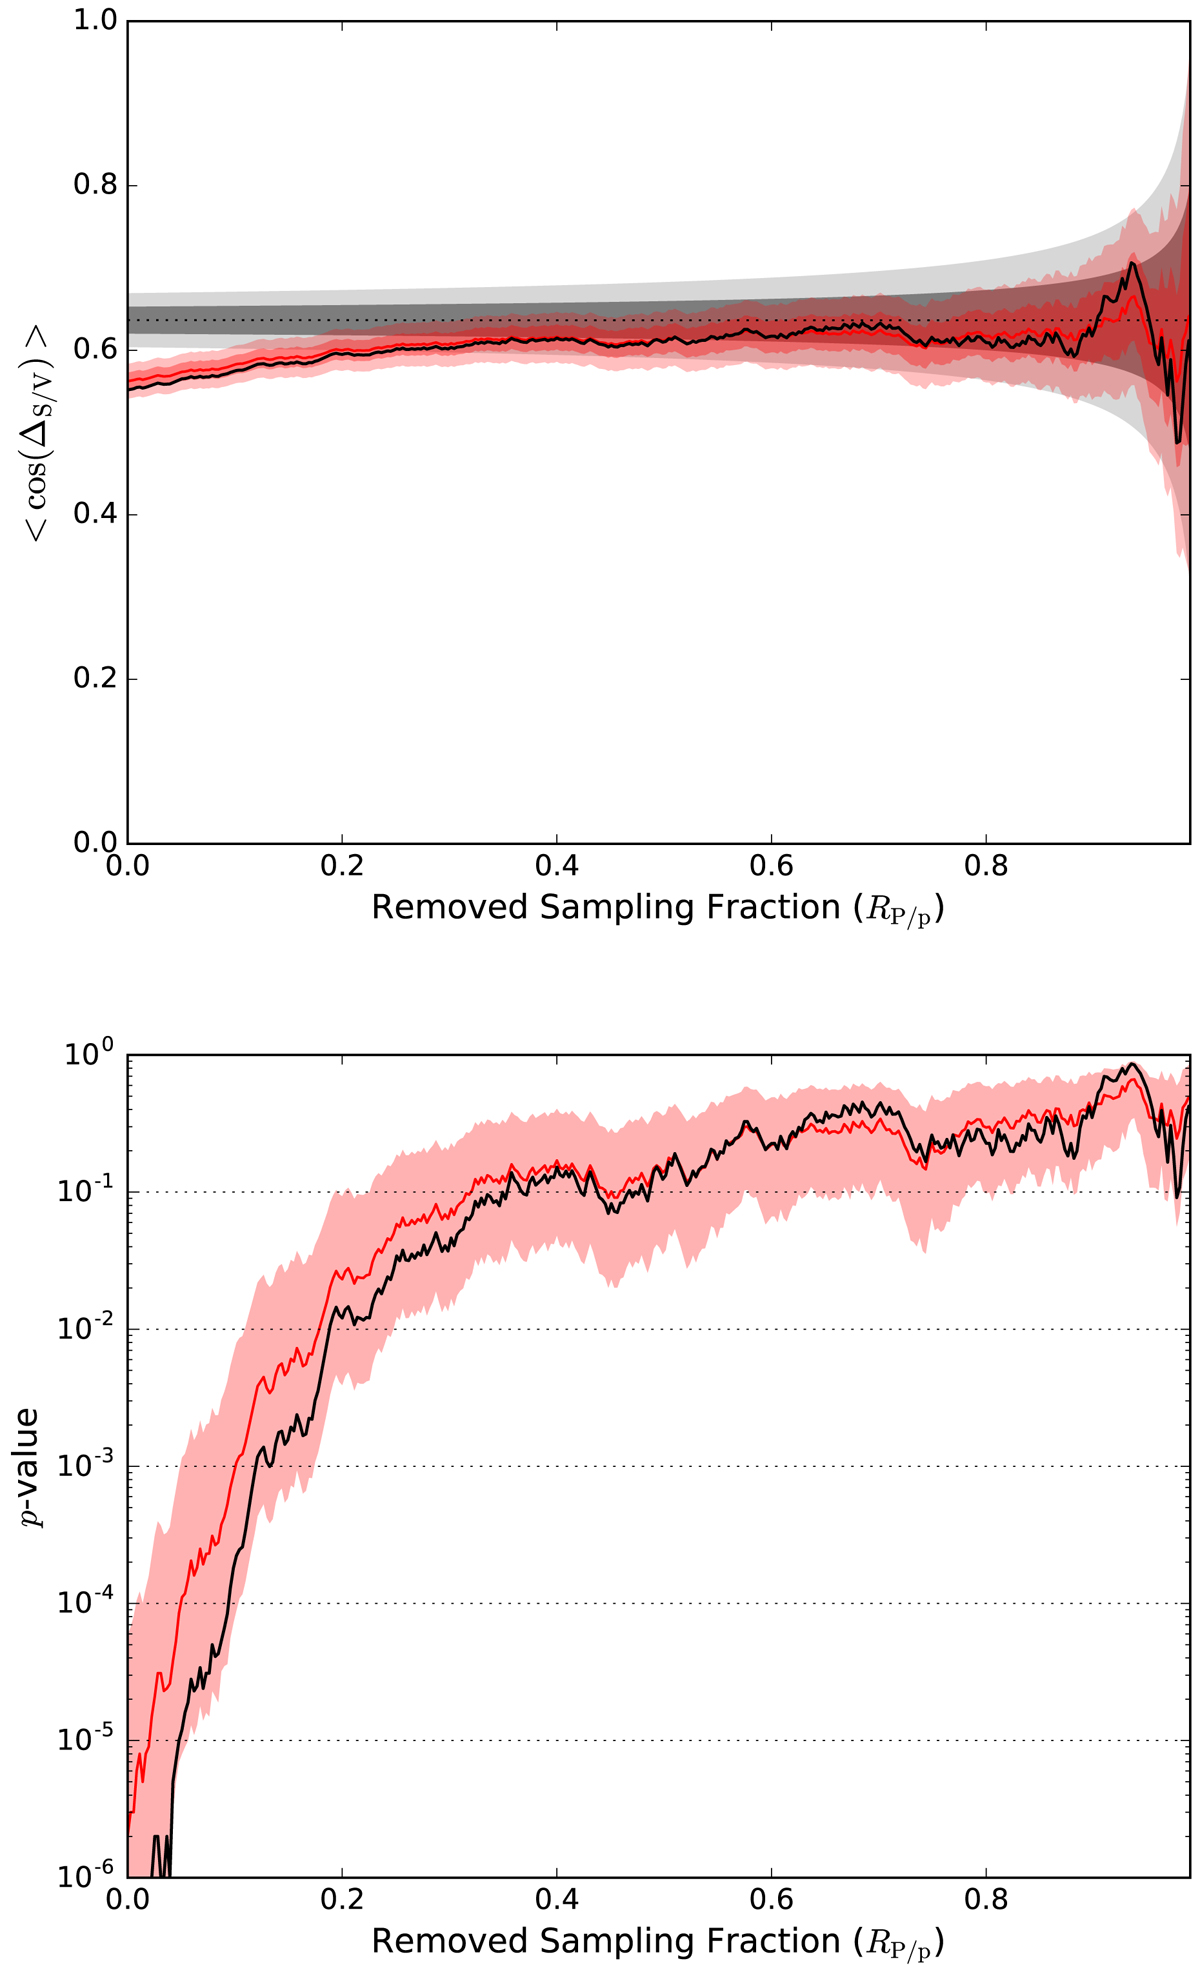
Top panel, in black: ⟨cos(ΔS/V⟩ value from the data as a function of the fraction of the sample that is removed according to the RP/p values of the data points (see text). The red line and shaded regions indicate the mean and the one and two sigma contours from the observational errors on the polarization position angles (dust and quasar). The gray shaded regions correspond to the one and two sigma deviations around the expected value (black dot horizontal line), assuming a uniform distribution of ΔS/V angles. Bottom panel: under the hypothesis of uniform distribution of ΔS/V, the black line is the p-value of the observation as a function of the removed fraction of the sample. The red line and shaded region correspond to the p-values computed for the mean and the one standard deviation from the mean of the observation accounting for the position angles uncertainties.
Current usage metrics show cumulative count of Article Views (full-text article views including HTML views, PDF and ePub downloads, according to the available data) and Abstracts Views on Vision4Press platform.
Data correspond to usage on the plateform after 2015. The current usage metrics is available 48-96 hours after online publication and is updated daily on week days.
Initial download of the metrics may take a while.