Open Access
Fig. 4.
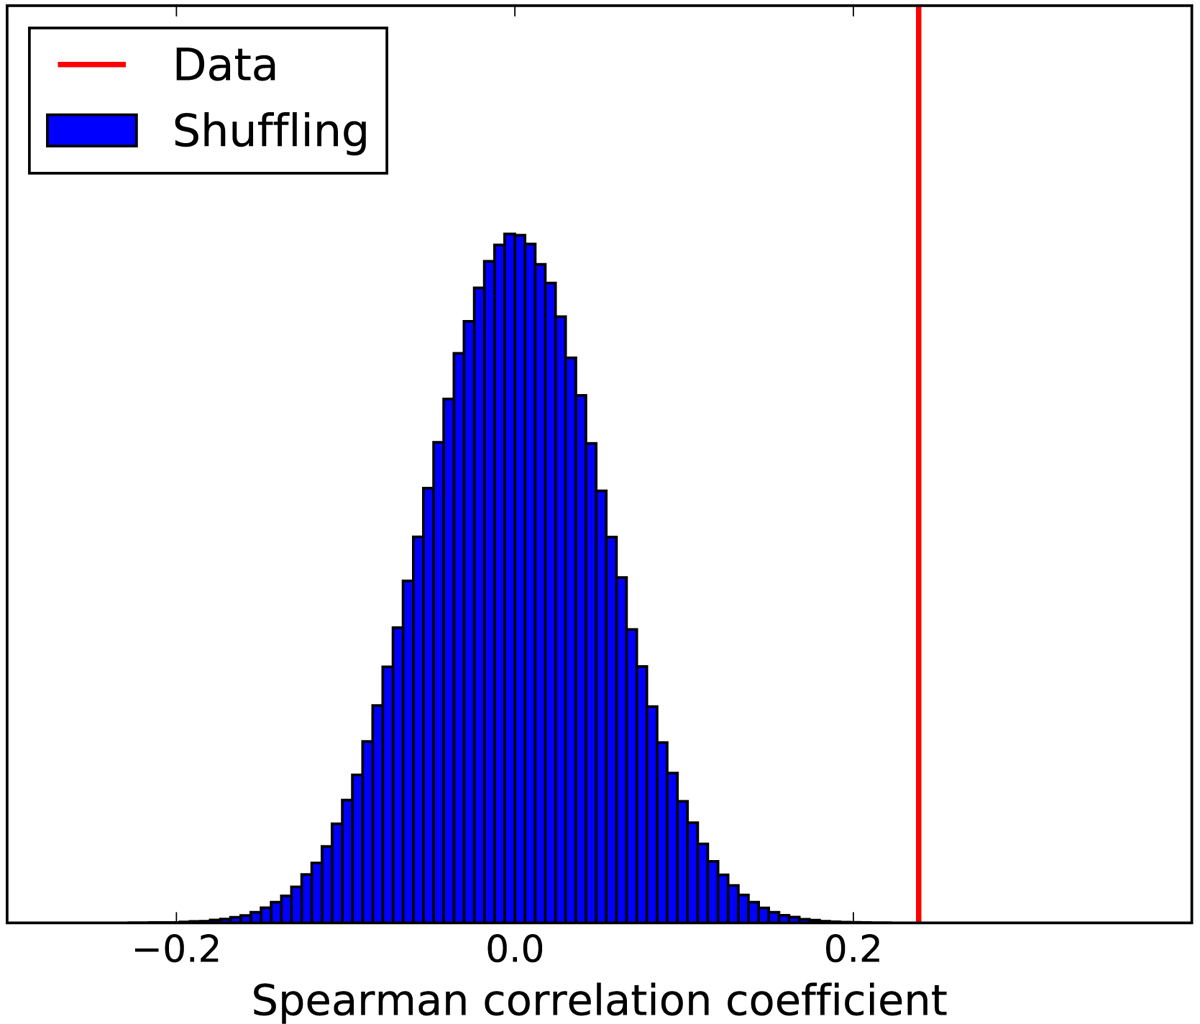
Spearman’s rank-order correlation coefficients between ΔS/V and RP/p. The histogram corresponds to the distribution obtained by shuffling 106 time the RP/p on the relative angles (ΔS/V). The (red) vertical line corresponds to the correlation coefficient obtained from the data.
Current usage metrics show cumulative count of Article Views (full-text article views including HTML views, PDF and ePub downloads, according to the available data) and Abstracts Views on Vision4Press platform.
Data correspond to usage on the plateform after 2015. The current usage metrics is available 48-96 hours after online publication and is updated daily on week days.
Initial download of the metrics may take a while.