Fig. 3.
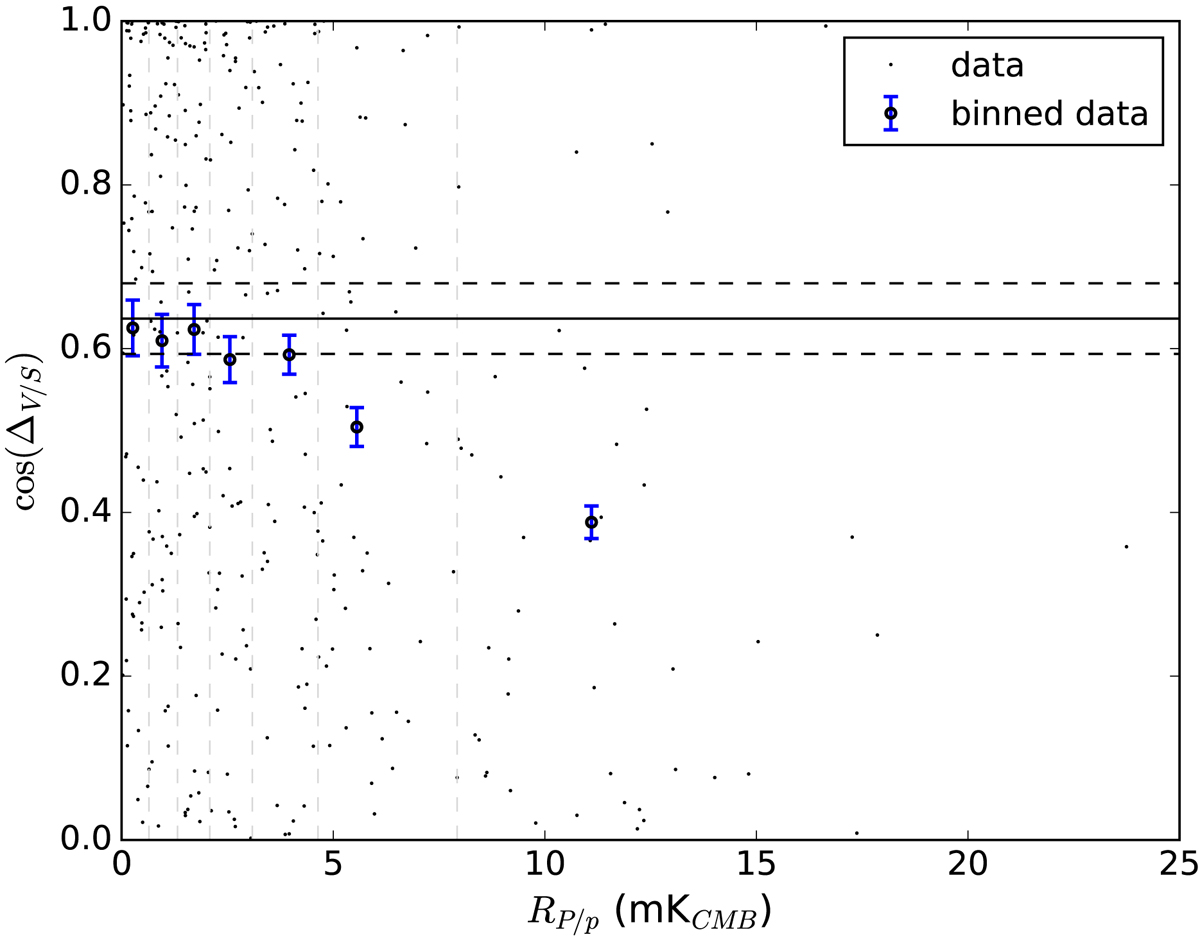
Scatter plot in the plane (cos(ΔS/V), RP/p) and binned data. The error bars correspond to the errors on the mean of cos(ΔS/V) in bin that are due to experimental uncertainties on polarization position angles (dust and quasars). Sampling errors in bin are about two times larger. Vertical gray lines show the borders of each bins. They were chosen such that each bin contains 51 data points, except the last one which contains 49. The horizontal tick line shows the expected mean under the assumption of uniformity in bin and the horizontal dashed lines show the one standard deviation from this mean, computed for 51 data points.
Current usage metrics show cumulative count of Article Views (full-text article views including HTML views, PDF and ePub downloads, according to the available data) and Abstracts Views on Vision4Press platform.
Data correspond to usage on the plateform after 2015. The current usage metrics is available 48-96 hours after online publication and is updated daily on week days.
Initial download of the metrics may take a while.