Fig. 1.
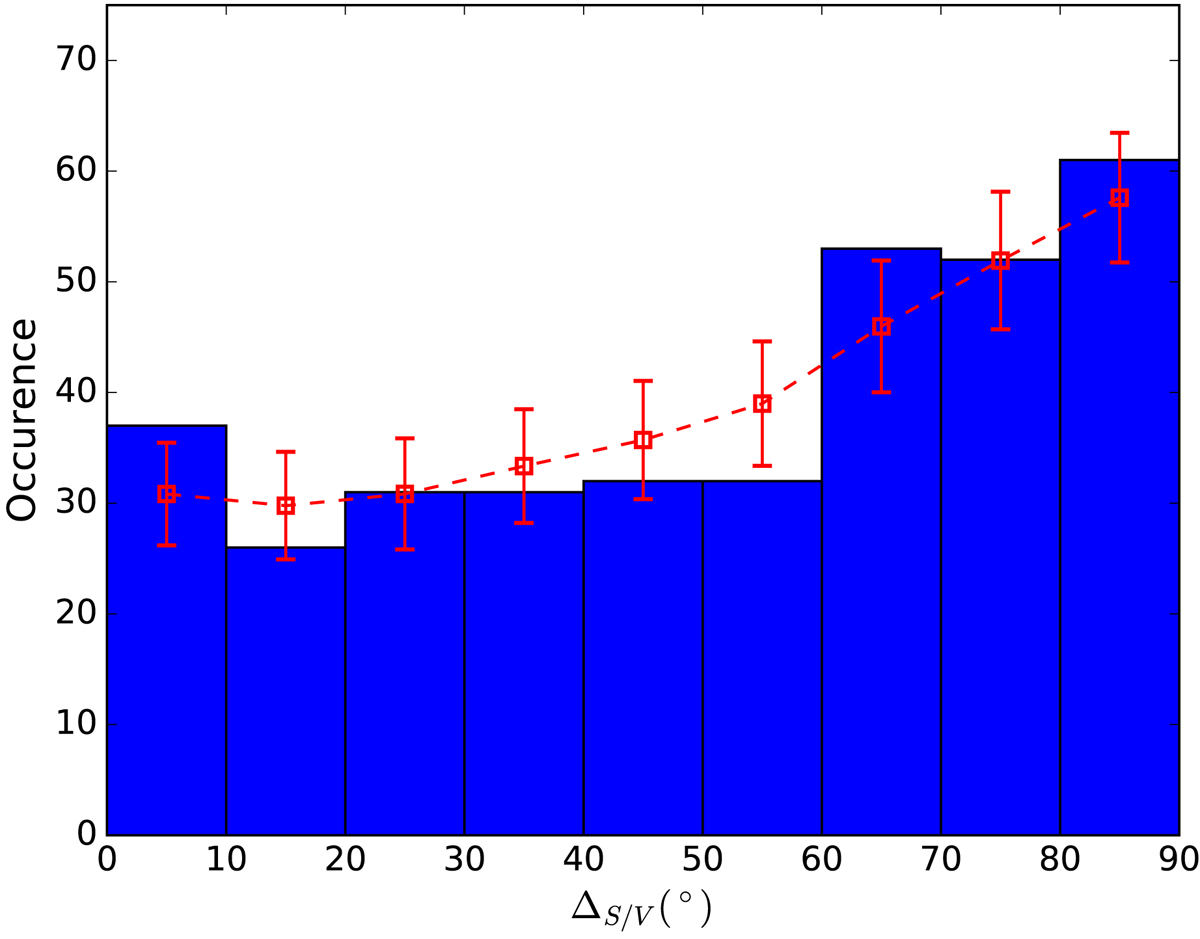
Histogram of the 355 relative angles ΔS/V computed as in Eq. (2). The observed distribution is significantly not uniform and shows an excess toward 90°, which corroborates a contamination scenario. The central values and error bars given in red account for observational uncertainties. The errors are estimated through 106 simulations in which we vary the polarization position angles of the quasars and dust around their values according to the observational uncertainties (see text for details). The central values and error bars correspond to the mean and dispersion in each bin obtained by computing the histogram for each simulation. The average correlation appears weaker because of the blurring of the correlation that the randomization of the angles within their uncertainties produces.
Current usage metrics show cumulative count of Article Views (full-text article views including HTML views, PDF and ePub downloads, according to the available data) and Abstracts Views on Vision4Press platform.
Data correspond to usage on the plateform after 2015. The current usage metrics is available 48-96 hours after online publication and is updated daily on week days.
Initial download of the metrics may take a while.