Fig. 7.
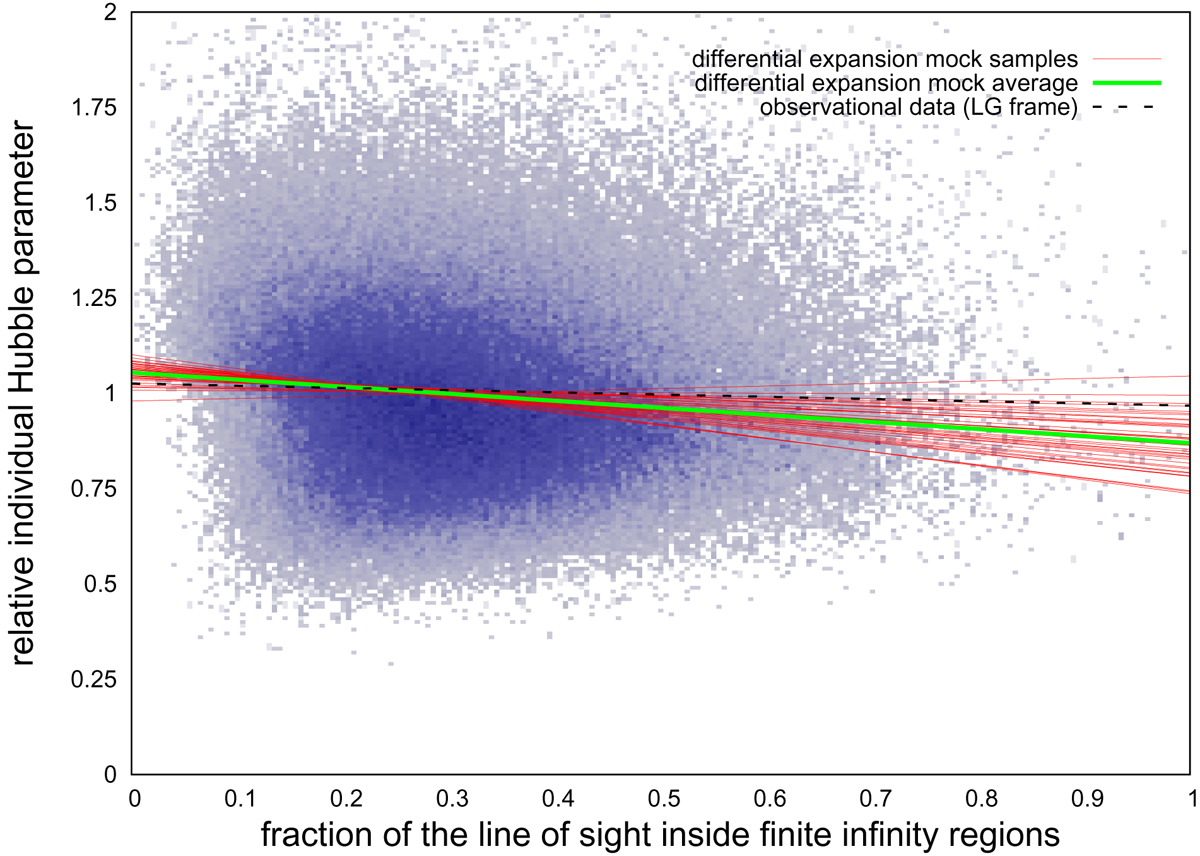
Diversity of the combined differential expansion mock catalogues. Red lines: weighted fits on combined mock catalogues; green line: the average obtained from theses fits; bluish point cloud: distribution of all galaxy groups hosting early-type galaxies weighted by number of early-type galaxies in them from all mock catalogues.
Current usage metrics show cumulative count of Article Views (full-text article views including HTML views, PDF and ePub downloads, according to the available data) and Abstracts Views on Vision4Press platform.
Data correspond to usage on the plateform after 2015. The current usage metrics is available 48-96 hours after online publication and is updated daily on week days.
Initial download of the metrics may take a while.