Fig. 3.
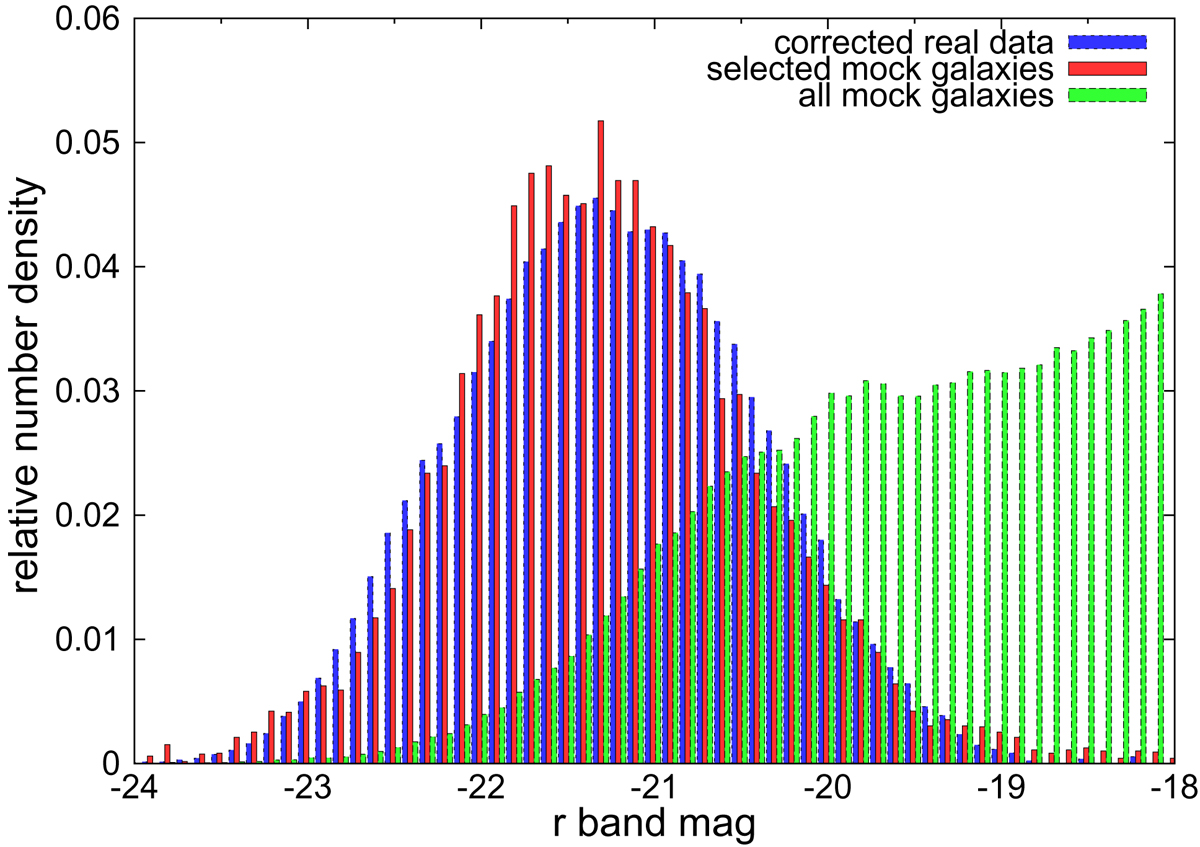
Comparison of the luminosity functions of the observational data and the simulated galaxies used for our mock catalogues. The blue histogram represents the Malmquist-bias corrected luminosity function of the early-type galaxies used to calibrate the fundamental plane. The red histogram shows the selected early-type galaxies from the Millennium simulation with the criteria mentioned in this chapter. The green histogram represents all galaxies from the Millennium simulation for comparison.
Current usage metrics show cumulative count of Article Views (full-text article views including HTML views, PDF and ePub downloads, according to the available data) and Abstracts Views on Vision4Press platform.
Data correspond to usage on the plateform after 2015. The current usage metrics is available 48-96 hours after online publication and is updated daily on week days.
Initial download of the metrics may take a while.