Free Access
Fig. 20.
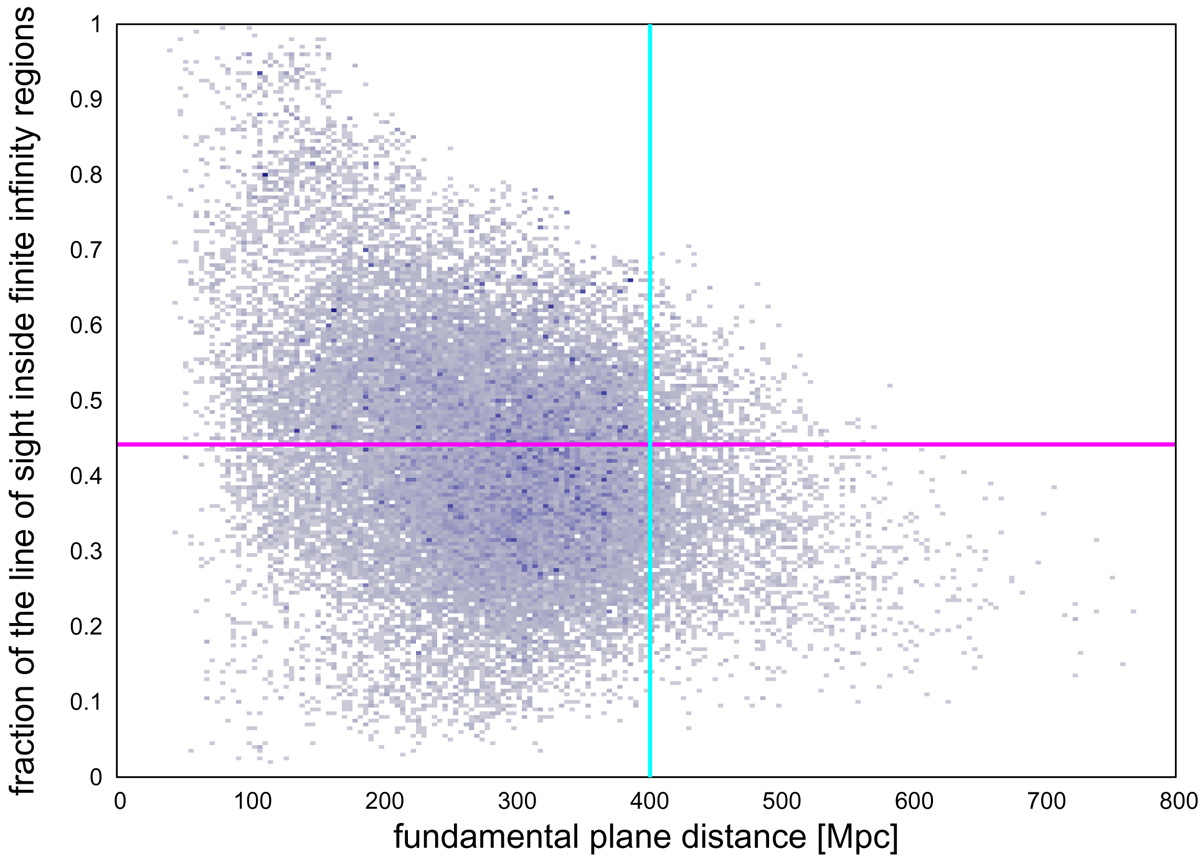
Distance dependence of the full observations data. Magenta dotted line: maximum distance for the selected sample. Magenta line: average fraction of the line of sight within finite infinity regions of the observational data; cyan line: distance limit for our selected sample.
Current usage metrics show cumulative count of Article Views (full-text article views including HTML views, PDF and ePub downloads, according to the available data) and Abstracts Views on Vision4Press platform.
Data correspond to usage on the plateform after 2015. The current usage metrics is available 48-96 hours after online publication and is updated daily on week days.
Initial download of the metrics may take a while.