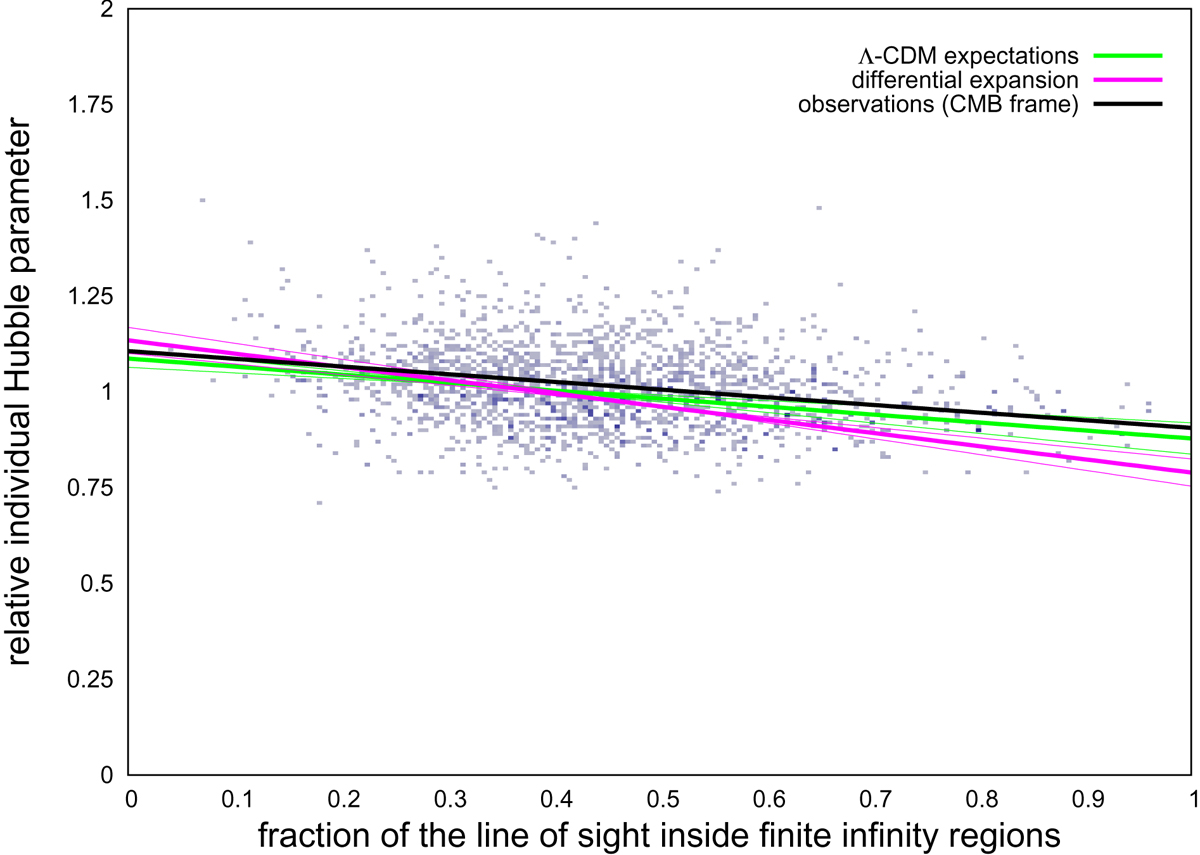
Fig. 17.

Key result IIa, using binned analysis: selected groups in the CMB rest frame compared to the model predictions. Black line: linear regression fit on the equally weighted bins of the observed data; green lines: averaged linear regression fit on the binned data of the Λ-CDM mock catalogues; magenta lines:averaged linear regression fit on the binned data of the timescape mock catalogues. The bins are the same as in Figs. 13 and 14, but are not explicitly shown to keep the plot clean.
Current usage metrics show cumulative count of Article Views (full-text article views including HTML views, PDF and ePub downloads, according to the available data) and Abstracts Views on Vision4Press platform.
Data correspond to usage on the plateform after 2015. The current usage metrics is available 48-96 hours after online publication and is updated daily on week days.
Initial download of the metrics may take a while.


