Fig. 13.
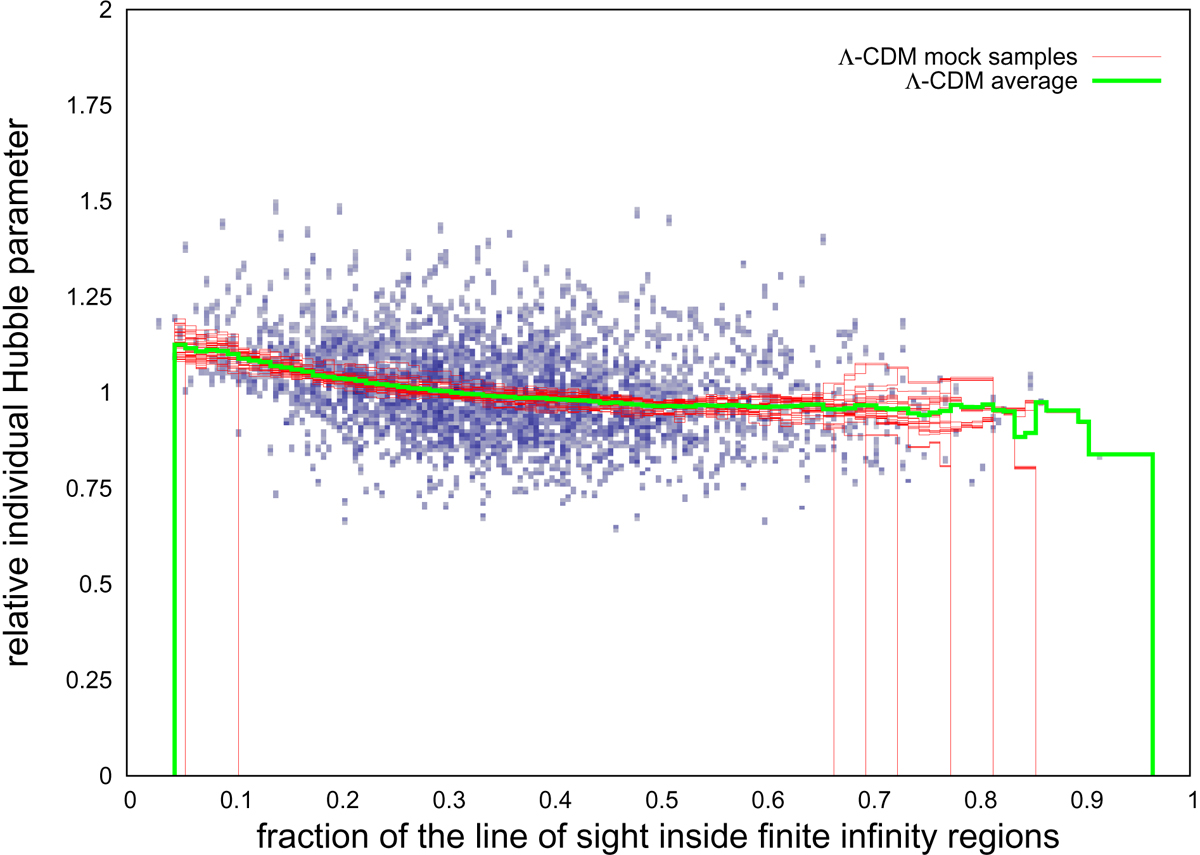
Diversity of the combined Λ-CDM mock catalogues. Red lines: weighted average in the bins of each combined mock catalogues only containing a selected sub-sample of groups; green line: the average in the bins of all combined mock catalogues; bluish point cloud: distribution of a selected sub-sample of groups in all mock catalogues.
Current usage metrics show cumulative count of Article Views (full-text article views including HTML views, PDF and ePub downloads, according to the available data) and Abstracts Views on Vision4Press platform.
Data correspond to usage on the plateform after 2015. The current usage metrics is available 48-96 hours after online publication and is updated daily on week days.
Initial download of the metrics may take a while.