Free Access
Fig. B.1.
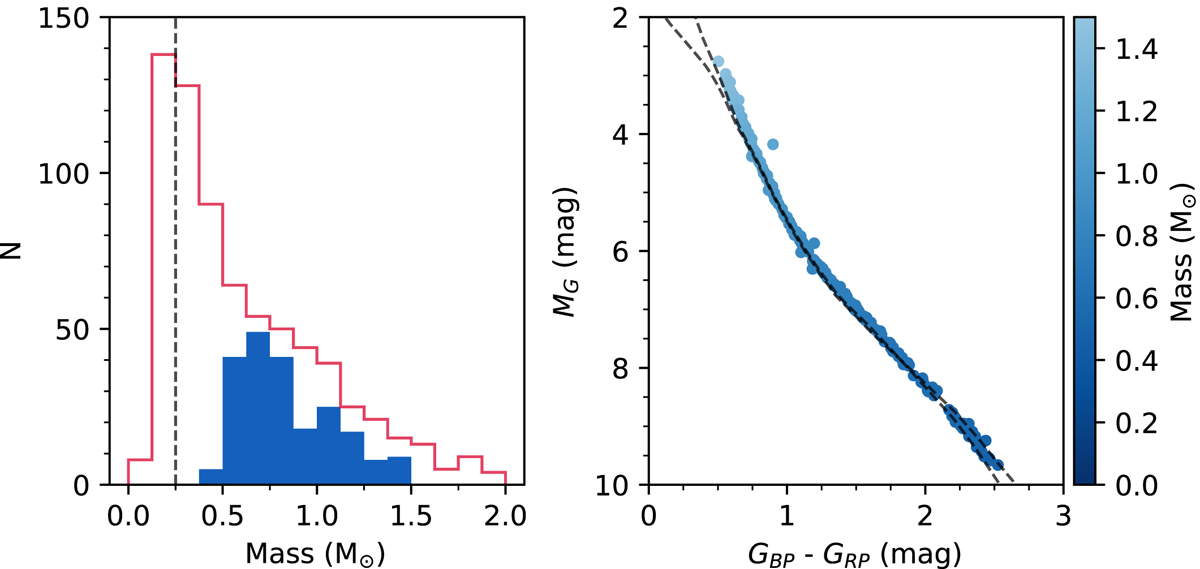
Mass spectrum of our Hyades member selection. Left panel: histogram of the derived masses, where the blue bars show our selection. The red histogram was constructed with data from Röser et al. (2011). Right panel: observational HRD with data color-coded by mass. The isochrones are the same as in Fig. 2.
Current usage metrics show cumulative count of Article Views (full-text article views including HTML views, PDF and ePub downloads, according to the available data) and Abstracts Views on Vision4Press platform.
Data correspond to usage on the plateform after 2015. The current usage metrics is available 48-96 hours after online publication and is updated daily on week days.
Initial download of the metrics may take a while.