Fig. 3.
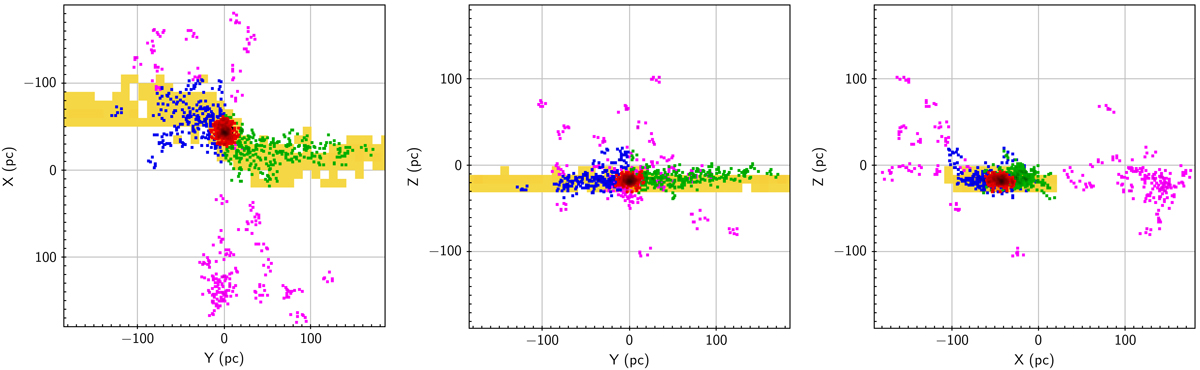
Hyades and their tidal tails. The figures show the spatial distributions of stars in dense regions with at least 2.5 × 10⁻³ stars per pc3 (see text for a further explanation of this selection). From left to right panels: distribution in the Y, X-, Y, Z-, and X, Z-planes. Stars selected in Gaia DR2 are shown as dots. In red we plot the Hyades cluster proper, in green the leading tail, in blue the trailing tail, and in pink all other stars in dense regions. The location of the predicted Hyades tidal tails from the model by Kharchenko et al. (2009) are indicated in yellow in the background.
Current usage metrics show cumulative count of Article Views (full-text article views including HTML views, PDF and ePub downloads, according to the available data) and Abstracts Views on Vision4Press platform.
Data correspond to usage on the plateform after 2015. The current usage metrics is available 48-96 hours after online publication and is updated daily on week days.
Initial download of the metrics may take a while.