Fig. 2.
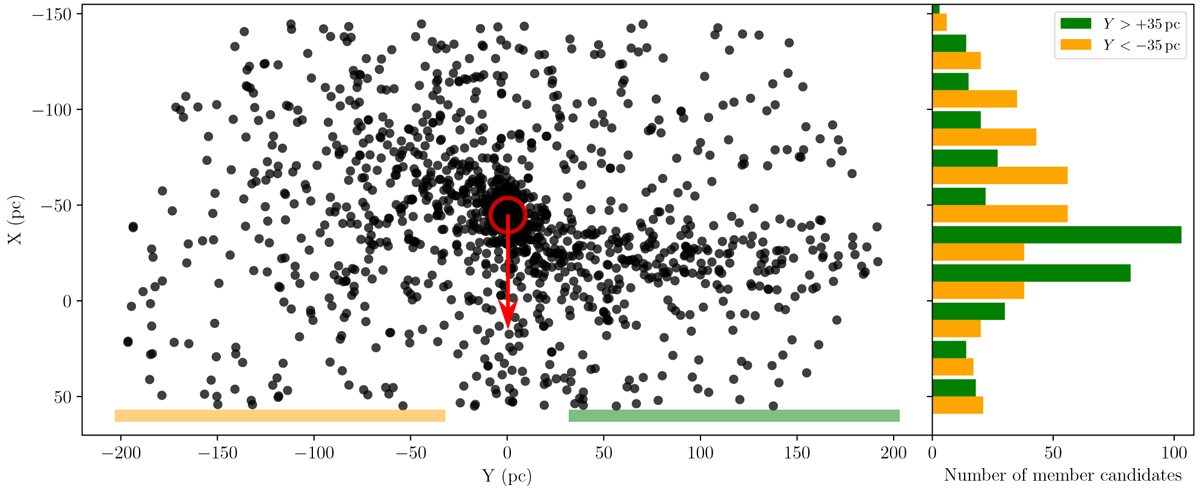
Left: distribution of the stars in the Y, X-plane after the cut in the tangential velocity plane according to the situation in Fig. 1, described in Sect. 2.2. The red circle indicates the tidal radius of 9 pc, and the red arrow points to the Galactic centre. Right: histogram of the marginal distribution in X; green shows the histogram for Y > 35 pc, and yellow represents Y < −35 pc.
Current usage metrics show cumulative count of Article Views (full-text article views including HTML views, PDF and ePub downloads, according to the available data) and Abstracts Views on Vision4Press platform.
Data correspond to usage on the plateform after 2015. The current usage metrics is available 48-96 hours after online publication and is updated daily on week days.
Initial download of the metrics may take a while.