Fig. 5.
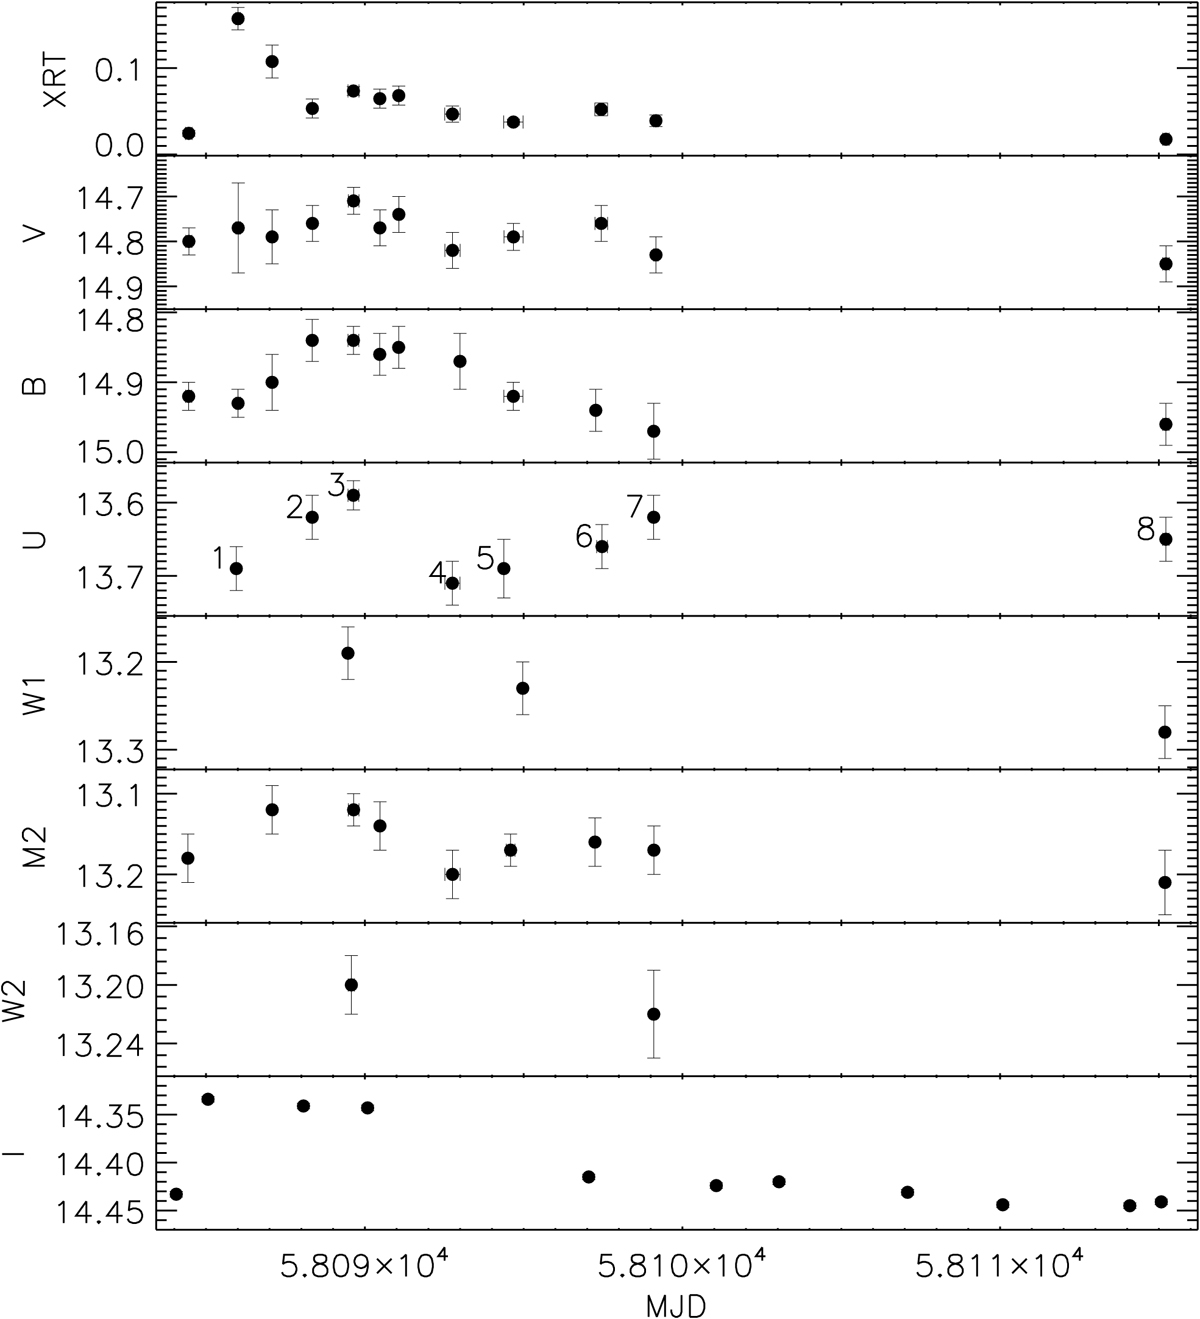
Swift/XRT (0.3−10 keV), UVOT (V, B, U, W1, M2, W2 bands), and OGLE (I band) light curves of AXJ0049.4–7323 obtained during the December 2017 monitoring campaign. Error bars indicate the 1σ statistical uncertainties. OGLE error bars and symbols are similar in size. UVOT systematic errors are comparable to the statistical ones.
Current usage metrics show cumulative count of Article Views (full-text article views including HTML views, PDF and ePub downloads, according to the available data) and Abstracts Views on Vision4Press platform.
Data correspond to usage on the plateform after 2015. The current usage metrics is available 48-96 hours after online publication and is updated daily on week days.
Initial download of the metrics may take a while.