Fig. 3.
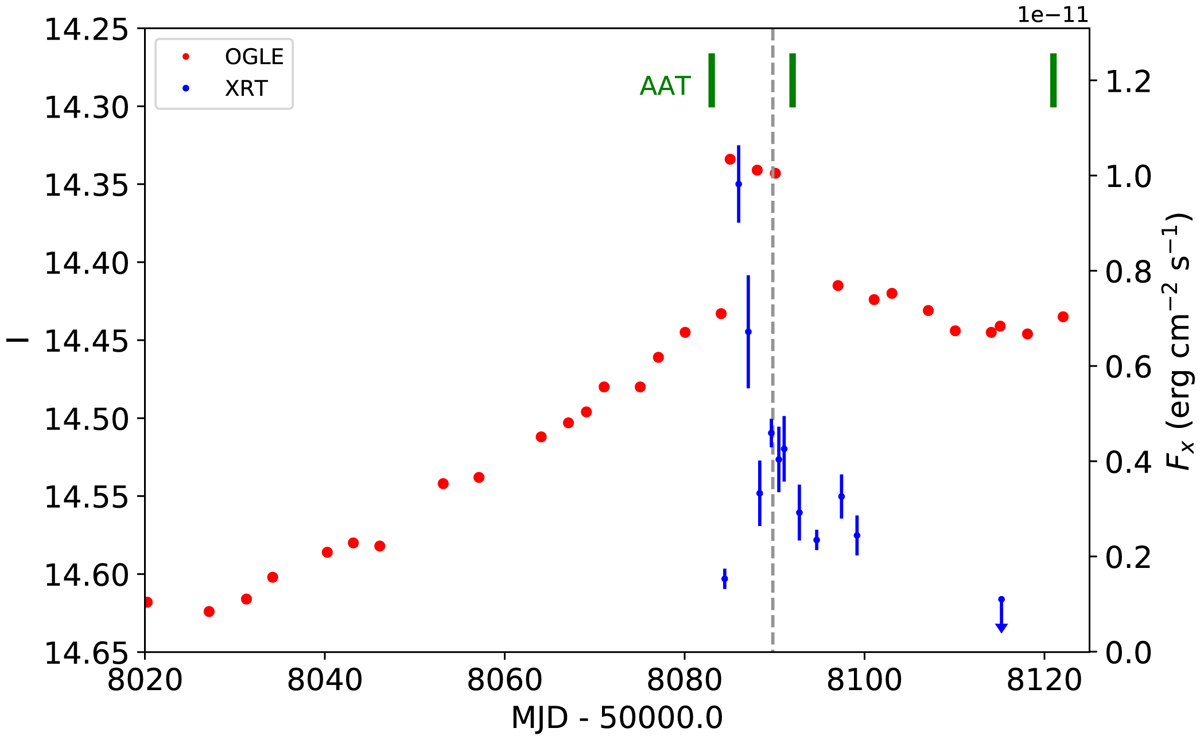
Magnified view of the December 2017 outburst seen by OGLE (red points). Superimposed are the 0.3−8 keV fluxes from the Swift/XRT monitoring of AXJ0049.4–7323 (blue points), and the times of the AAT observations (green bars). The grey vertical dashed line shows the expected time of the peak of the optical outburst calculated with the ephemeris of Schmidtke et al. (2013).
Current usage metrics show cumulative count of Article Views (full-text article views including HTML views, PDF and ePub downloads, according to the available data) and Abstracts Views on Vision4Press platform.
Data correspond to usage on the plateform after 2015. The current usage metrics is available 48-96 hours after online publication and is updated daily on week days.
Initial download of the metrics may take a while.