Fig. 1.
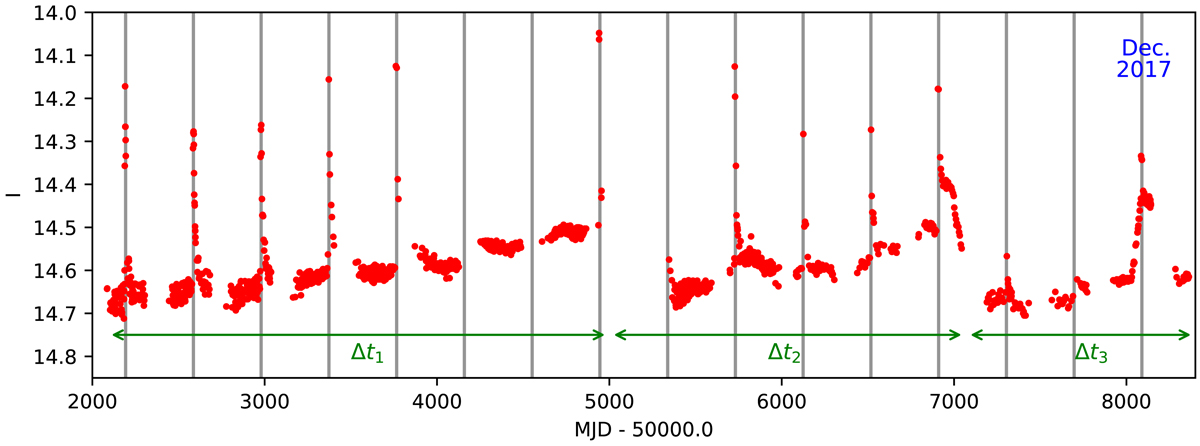
OGLE light curve of AXJ0049.4–7323 from June 2001 to September 2018. The grey vertical lines show the times of the peak of the optical outbursts according to the ephemeris calculated by Schmidtke et al. (2013). The green arrows at the bottom of the figure show the three epochs of gradual brightening of the basal emission (see Sect. 3.1).
Current usage metrics show cumulative count of Article Views (full-text article views including HTML views, PDF and ePub downloads, according to the available data) and Abstracts Views on Vision4Press platform.
Data correspond to usage on the plateform after 2015. The current usage metrics is available 48-96 hours after online publication and is updated daily on week days.
Initial download of the metrics may take a while.