Fig. 2.
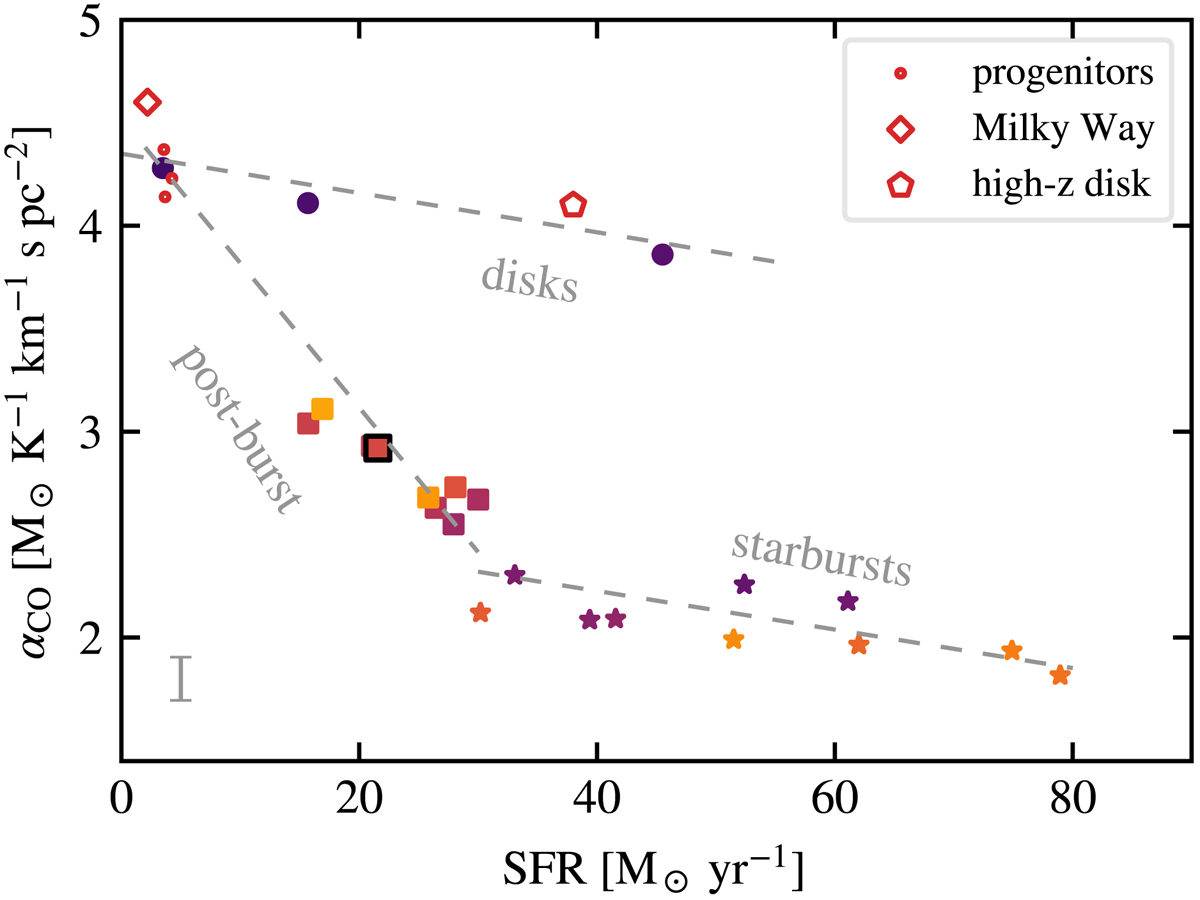
αco as a function of the SFR (measured over 5 Myr) in the merger and in simulations of other galaxies. (The system starts in the top left corner, and at first order, moves clockwise). The symbols are the same as in Fig. 1. The dashed lines indicate linear fits (αco = aSFR + b) to three regimes: disk galaxies, starbursts, and post-burst phases (see text). The typical dispersions of αco (estimated by varying the line of sight, see text) is shown in the bottom left corner.
Current usage metrics show cumulative count of Article Views (full-text article views including HTML views, PDF and ePub downloads, according to the available data) and Abstracts Views on Vision4Press platform.
Data correspond to usage on the plateform after 2015. The current usage metrics is available 48-96 hours after online publication and is updated daily on week days.
Initial download of the metrics may take a while.