Fig. 1.
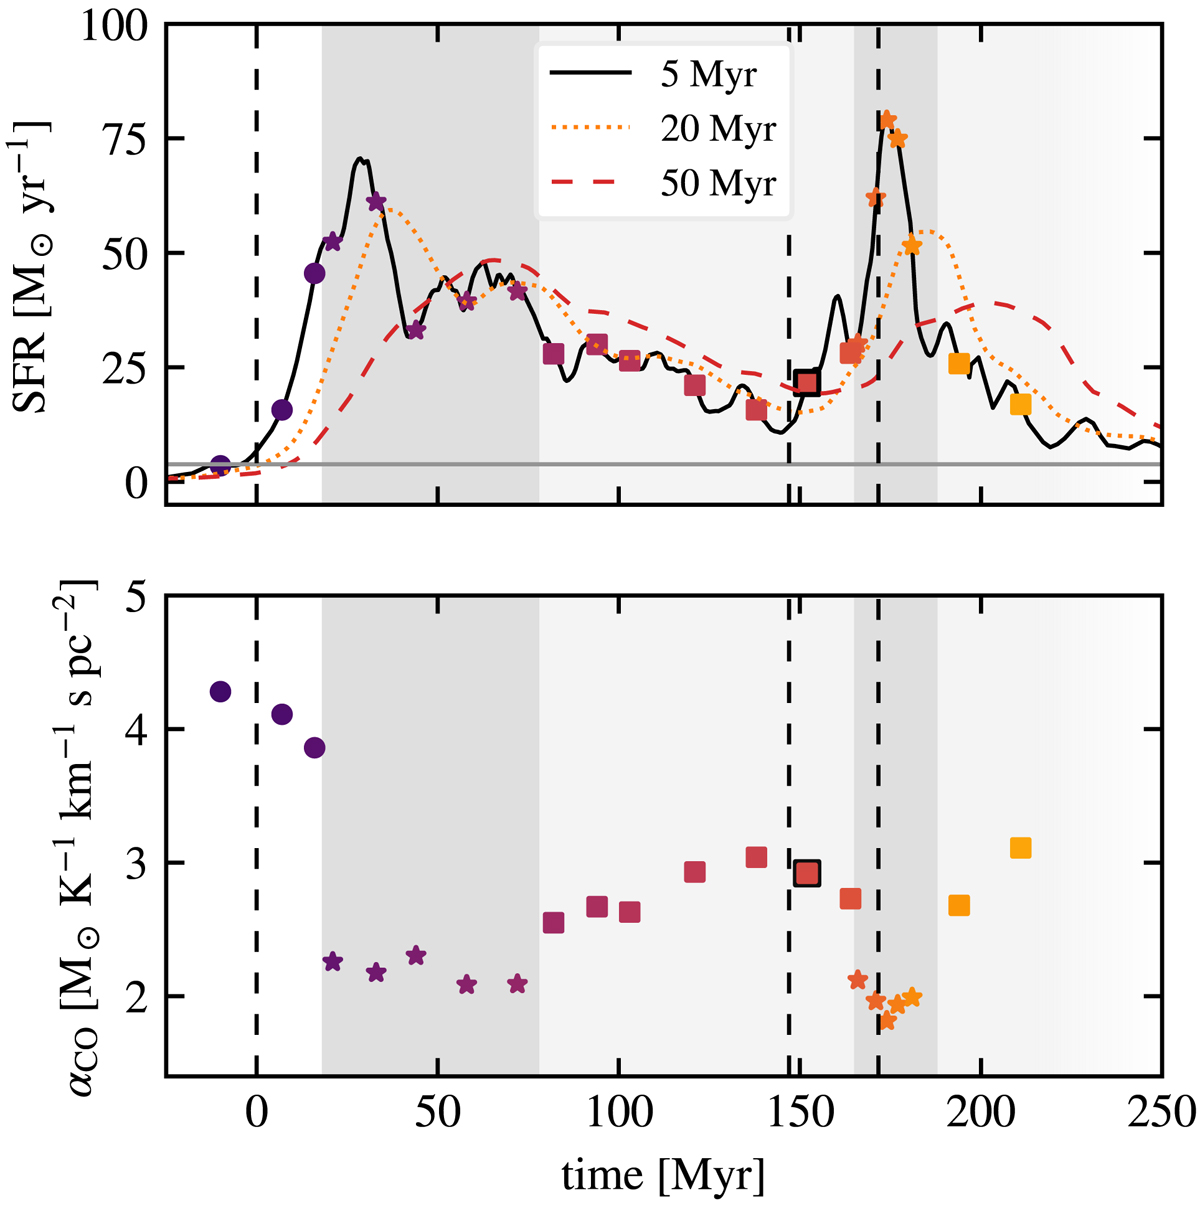
Top panel: evolution of the SFR measured over the last 5, 20, and 50 Myr. Vertical lines indicate the pericenter passages. Symbols mark the instants selected for analysis, with their color-coding time. Their shapes and the shaded areas correspond to the regimes identified below: white, dark gray, and light gray for the disk, starburst, and post-burst regimes, respectively. The black square indicates the instant of best morphological match with the observed Antennae merger. The gray line is the SFR of the progenitor galaxies, run in isolation (i.e., an almost constant SFR of ≈1.5 M⊙yr−1 for each galaxy). Bottom panel: evolution of αco.
Current usage metrics show cumulative count of Article Views (full-text article views including HTML views, PDF and ePub downloads, according to the available data) and Abstracts Views on Vision4Press platform.
Data correspond to usage on the plateform after 2015. The current usage metrics is available 48-96 hours after online publication and is updated daily on week days.
Initial download of the metrics may take a while.