Fig. 5.
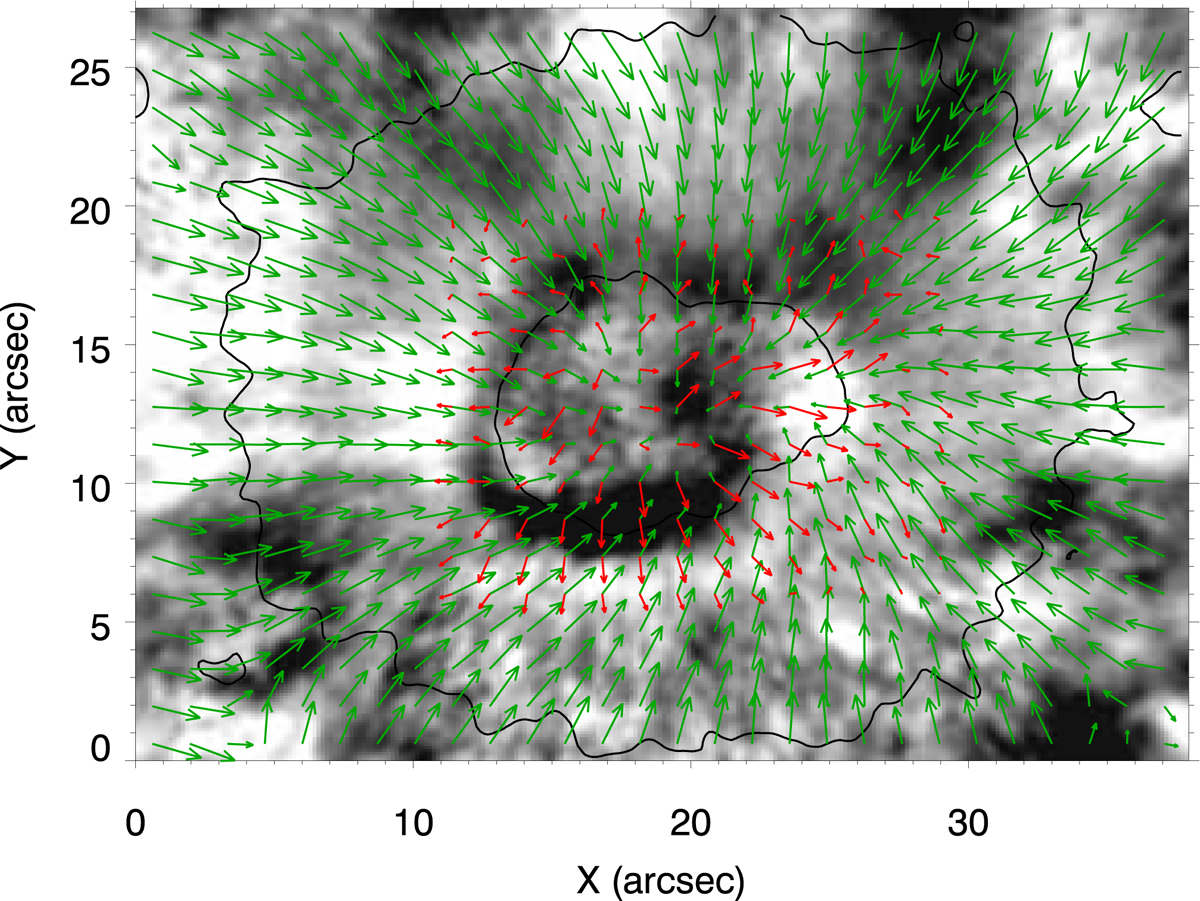
Doppler velocity map inferred from the GFPI Fe I 5435 Å restored images at t = 3830 s. Black color indicates upflows and white color corresponds to downflows. Green arrows display the direction and magnitude of the horizontal magnetic field inferred from GRIS Si I 10 827 Å observations and red arrows show the direction and magnitude of the wavefronts’ phase speed determined by tracking the wavefronts from GFPI data. The longest red arrows correspond to a phase velocity of 20 km s−1.
Current usage metrics show cumulative count of Article Views (full-text article views including HTML views, PDF and ePub downloads, according to the available data) and Abstracts Views on Vision4Press platform.
Data correspond to usage on the plateform after 2015. The current usage metrics is available 48-96 hours after online publication and is updated daily on week days.
Initial download of the metrics may take a while.