Fig. 4.
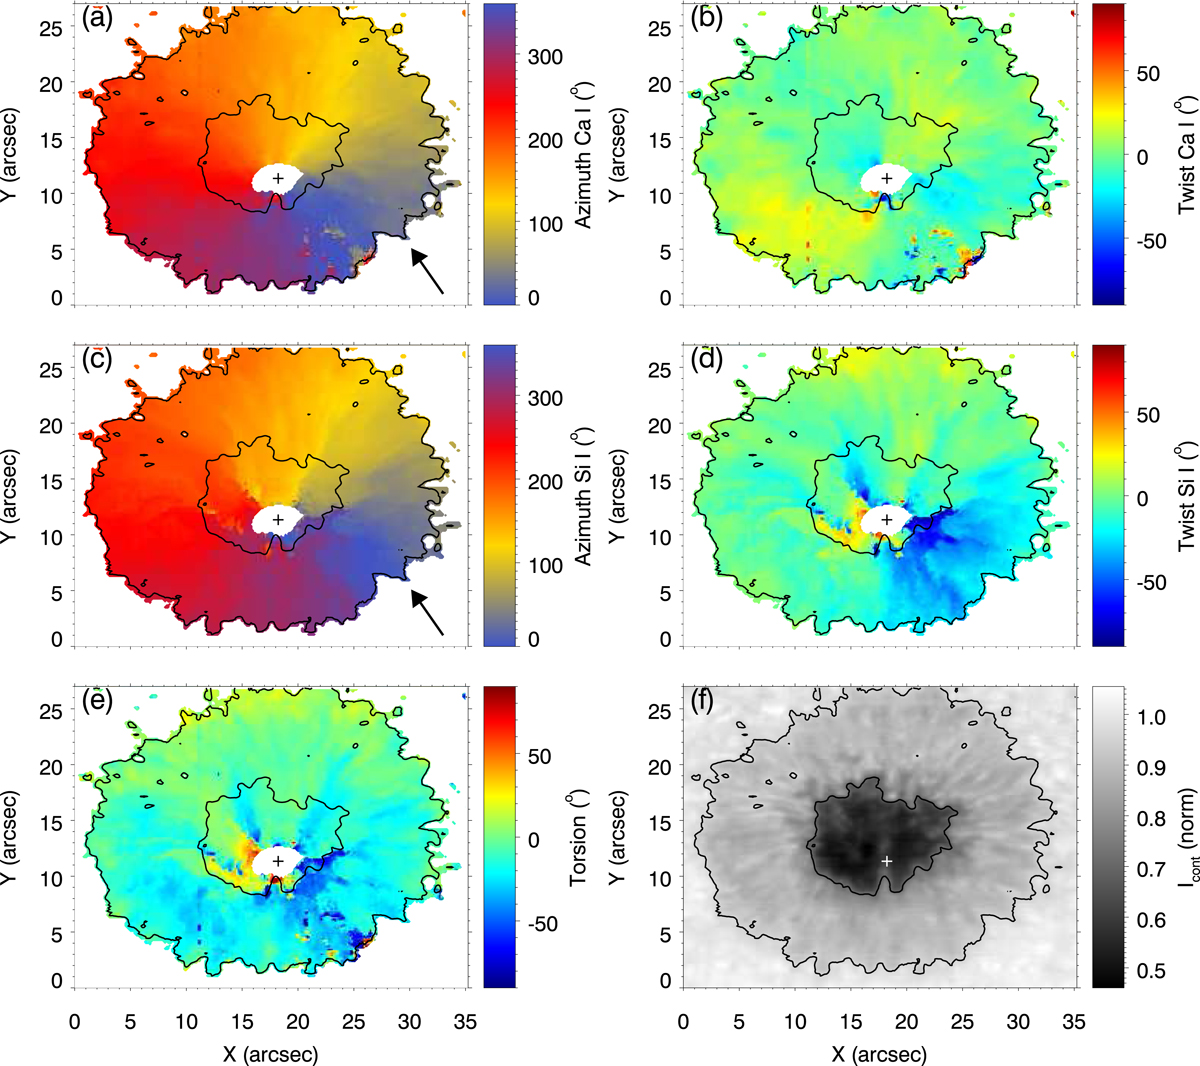
Physical parameters inferred from the GRIS observations. Top row: magnetic field azimuth (panel a) and magnetic twist (panel b) measured with the Ca I 10 839 Å line. Middle row: magnetic field azimuth (panel c) and magnetic twist (panel d) measured with the Si I 10 827 Å line. Bottom row: magnetic torsion, defined as the difference between the azimuths obtained from the Si I 10 827 Å and Ca I 10 839 Å lines (panel e), and continuum intensity from GRIS raster map (panel f). The azimuth is defined as the angle between the horizontal component of the magnetic field and the solar west-east direction. The arrow at the bottom right of panels (a and c) points to the direction of an azimuth value of 0°. The azimuth increases counterclockwise. Black lines indicate the umbral and penumbral boundaries, as determined from contours of constant intensity. The cross shows the position selected as the center of the sunspot for the calculation of the magnetic twist in panels b and d. In panels a–e, regions with quiet Sun intensity and the center of the spot, where the estimation of the azimuth is not reliable, have been masked out.
Current usage metrics show cumulative count of Article Views (full-text article views including HTML views, PDF and ePub downloads, according to the available data) and Abstracts Views on Vision4Press platform.
Data correspond to usage on the plateform after 2015. The current usage metrics is available 48-96 hours after online publication and is updated daily on week days.
Initial download of the metrics may take a while.