Free Access
Fig. 3.
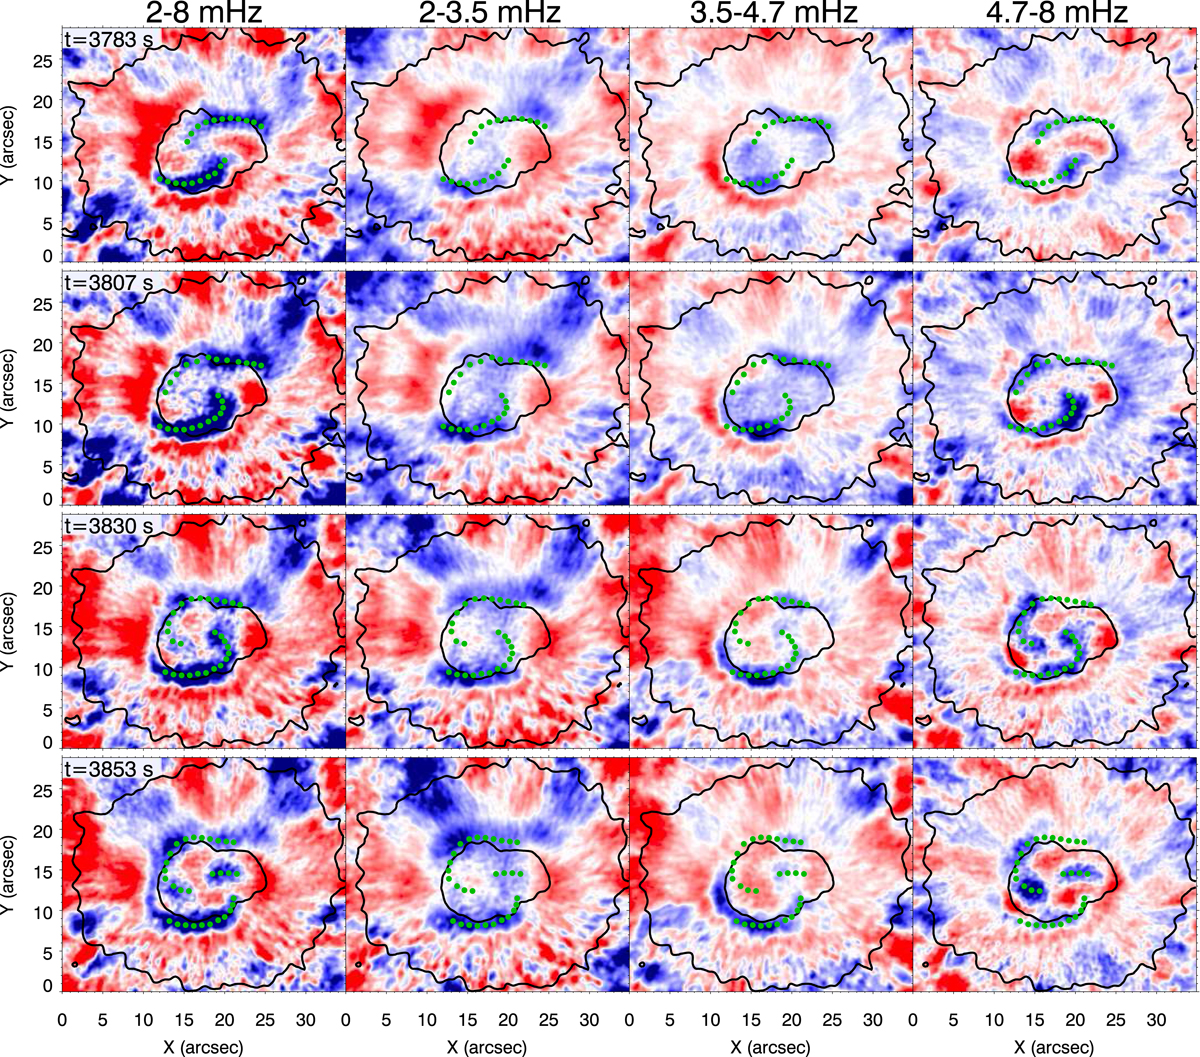
Temporal evolution of the Doppler velocity, inferred from the GFPI Fe I 5435 Å restored images, during the appearance of a two-armed spiral wavefront, filtered in frequency bands. From left to right columns: 2–8 mHz, 2–3.5 mHz, 3.5–4.7 mHz, 4.7–8 mHz. The black lines and green circles have the same meaning as in Fig. 2.
Current usage metrics show cumulative count of Article Views (full-text article views including HTML views, PDF and ePub downloads, according to the available data) and Abstracts Views on Vision4Press platform.
Data correspond to usage on the plateform after 2015. The current usage metrics is available 48-96 hours after online publication and is updated daily on week days.
Initial download of the metrics may take a while.