Fig. 2.
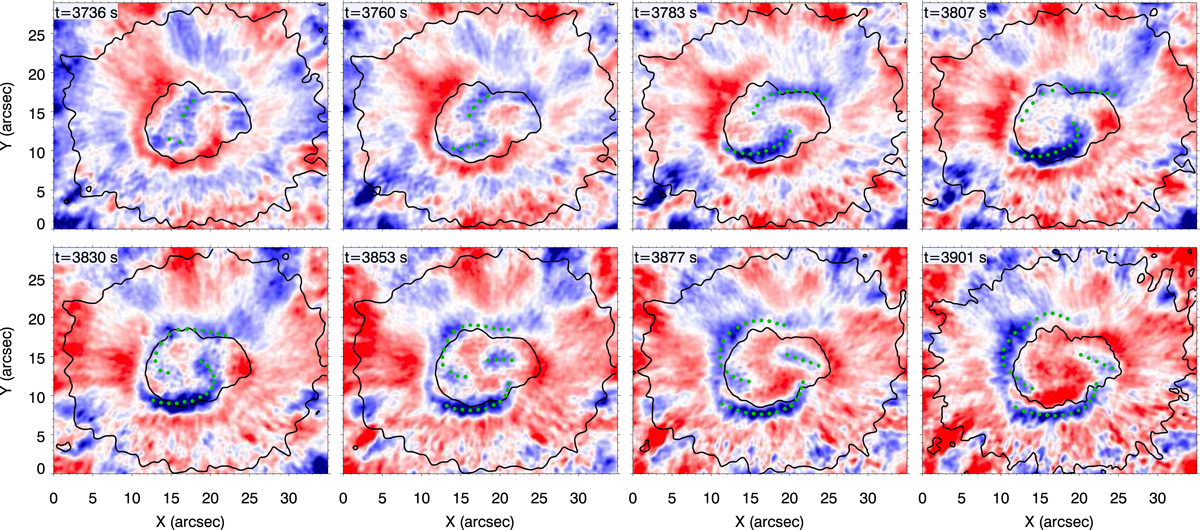
Temporal evolution of the Doppler velocity, inferred from the GFPI Fe I 5435 Å restored images, during the appearance of a two-armed spiral wavefront. Blue (red) color indicates upflows (downflows). Velocities are saturated for amplitudes higher than 300 m s−1. The black lines mark the umbral and penumbral boundaries, as determined from contours of constant intensity. The green circles highlight the location of the spiral wavefronts. The time in the top-left corner of each panel shows the seconds since the beginning of the observations (08:10:08 UT). A movie is provided in online.
Current usage metrics show cumulative count of Article Views (full-text article views including HTML views, PDF and ePub downloads, according to the available data) and Abstracts Views on Vision4Press platform.
Data correspond to usage on the plateform after 2015. The current usage metrics is available 48-96 hours after online publication and is updated daily on week days.
Initial download of the metrics may take a while.