Fig. 7.
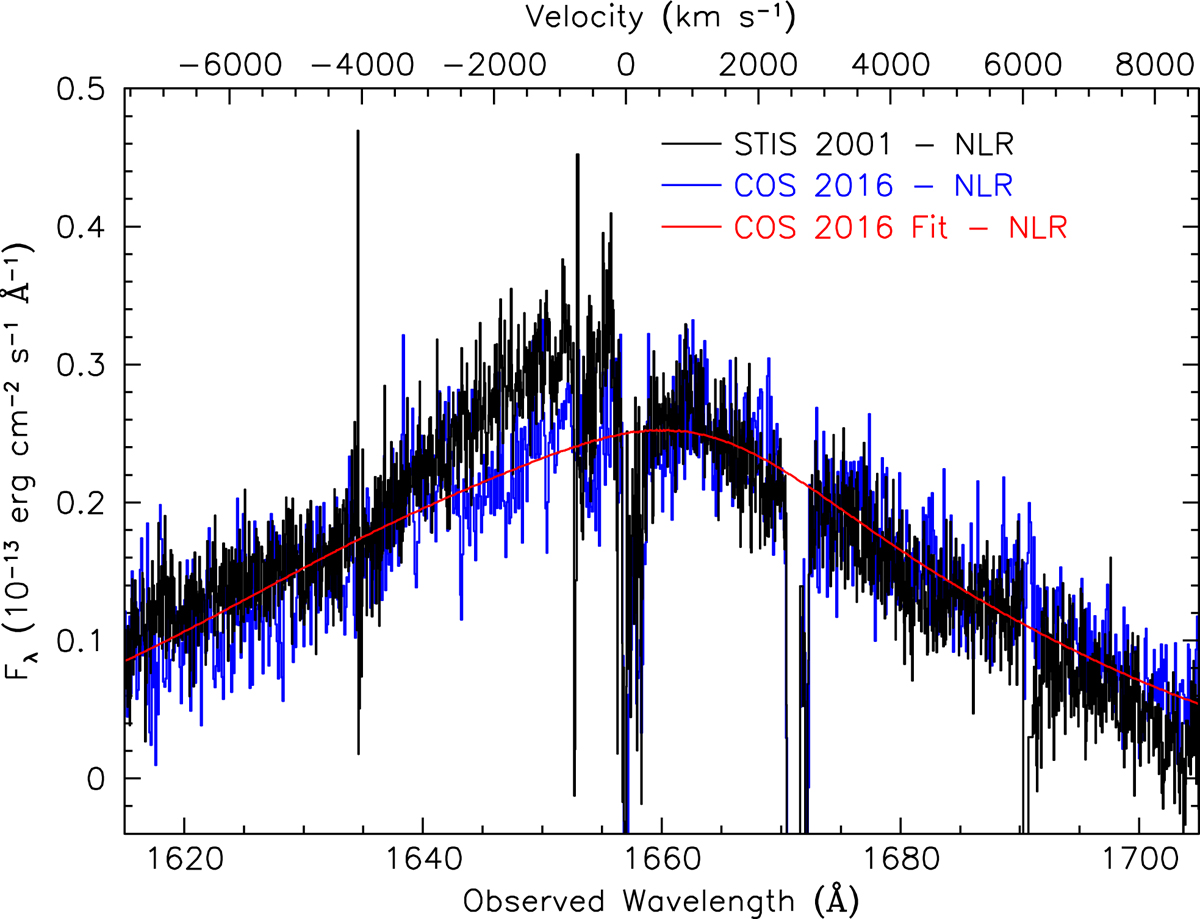
Comparison of STIS and COS spectra of the region surrounding the He II emission line omitting the narrow emission. The black histogram shows the average STIS 2001 spectrum with the narrow components of He II and O III] subtracted. The blue histogram shows the unweighted average COS spectrum from the 12 December 2016 and 21 December 2016 observations, also with the narrow components subtracted. Both spectra have the continuum subtracted as well as the underlying emission of the C IV emission line. The STIS spectrum is scaled up 1.2× to match the flux in the far wings of the COS spectrum. The solid red line represents the best-fit emission model for the COS spectrum. The velocity scale along the top axis has zero velocity for He IIλ1640.45 at the host-galaxy redshift of 0.00973 (Theureau et al. 1998).
Current usage metrics show cumulative count of Article Views (full-text article views including HTML views, PDF and ePub downloads, according to the available data) and Abstracts Views on Vision4Press platform.
Data correspond to usage on the plateform after 2015. The current usage metrics is available 48-96 hours after online publication and is updated daily on week days.
Initial download of the metrics may take a while.