Fig. 29.
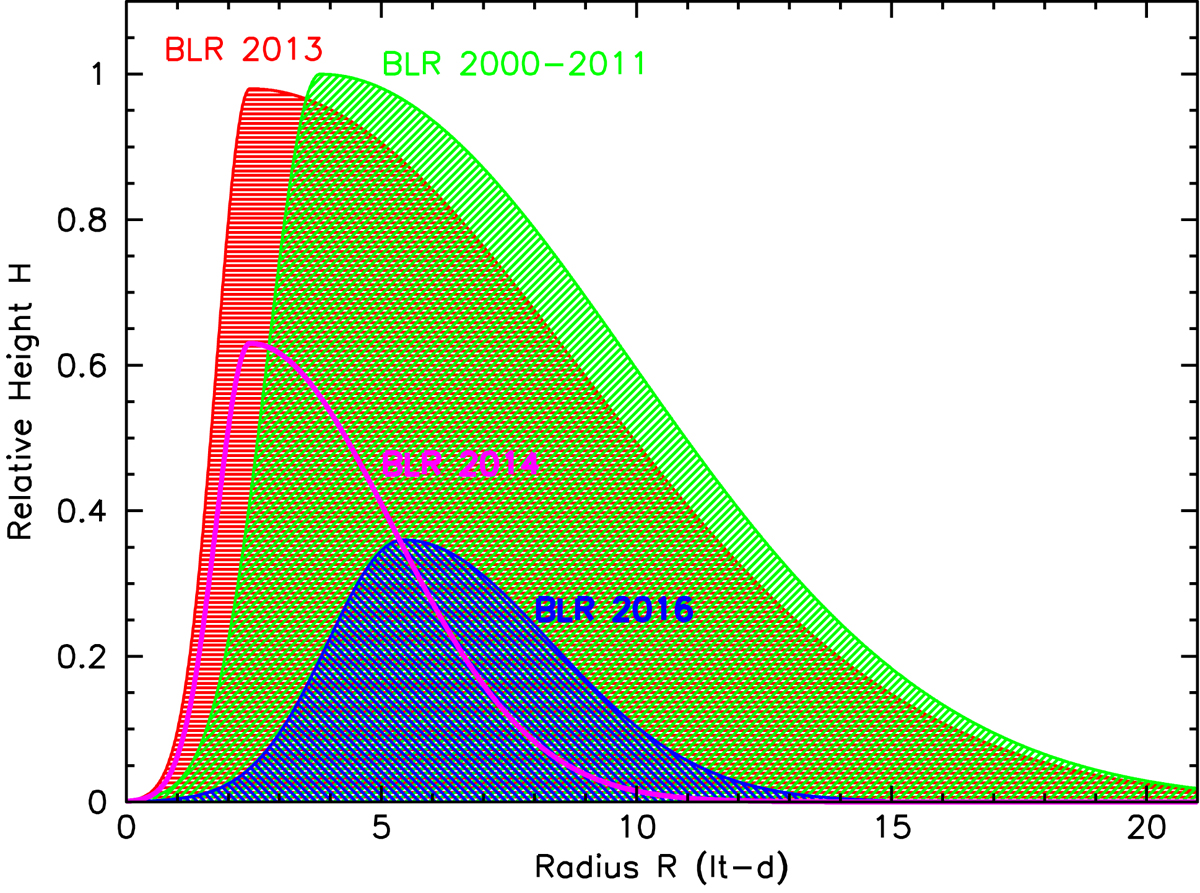
Schematic representation of the evolution of the BLR in NGC 3783. The green shaded area represents the vertical structure and radial extent of the BLR during the period from 2000 to 2011. The red shaded area shows the inferred structure in 2013, when the continuum flux was 2.5× less, but the EW of C IV was 70% higher. The magenta curve is the hypothetical structure in 2014, when the continuum flux was still low after the BLR had dynamically adjusted to the lower flux level. The blue shaded area is the inferred structure at the time of the obscuration event in 2016.
Current usage metrics show cumulative count of Article Views (full-text article views including HTML views, PDF and ePub downloads, according to the available data) and Abstracts Views on Vision4Press platform.
Data correspond to usage on the plateform after 2015. The current usage metrics is available 48-96 hours after online publication and is updated daily on week days.
Initial download of the metrics may take a while.