Fig. 25.
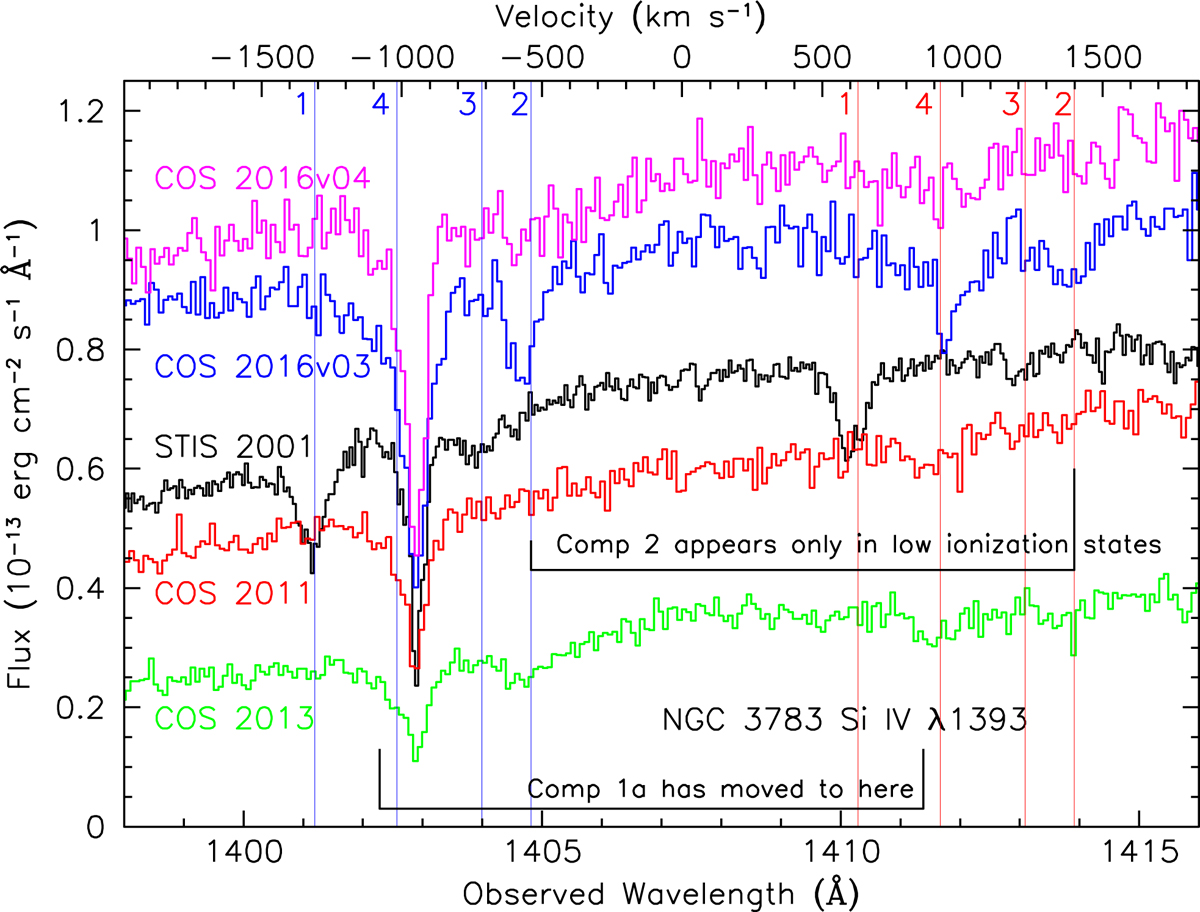
HST spectra of the Si IV region from five different epochs as labeled. Fluxes and wavelengths are as observed. The wavelengths of Components 1–4 as given by Gabel et al. (2003b) are marked by thin vertical blue lines and labeled; thin vertical red lines mark the expected locations of the red component of the Si IV doublet. Note that absorption in Component #2, which is strong only in low-flux states in all prior observations, appears strongest during the 2016-12-12 COS observation, which was taken at the time that X-ray obscuration was strongest. Also, the low-ionization Component #1a, which is the “decelerating” absorption-line cloud (Gabel et al. 2003b; Scott et al. 2014), has decelerated to an observed wavelength of 1403 Å, where it is blended with Galactic Si IVλ1403.
Current usage metrics show cumulative count of Article Views (full-text article views including HTML views, PDF and ePub downloads, according to the available data) and Abstracts Views on Vision4Press platform.
Data correspond to usage on the plateform after 2015. The current usage metrics is available 48-96 hours after online publication and is updated daily on week days.
Initial download of the metrics may take a while.