Fig. 19.
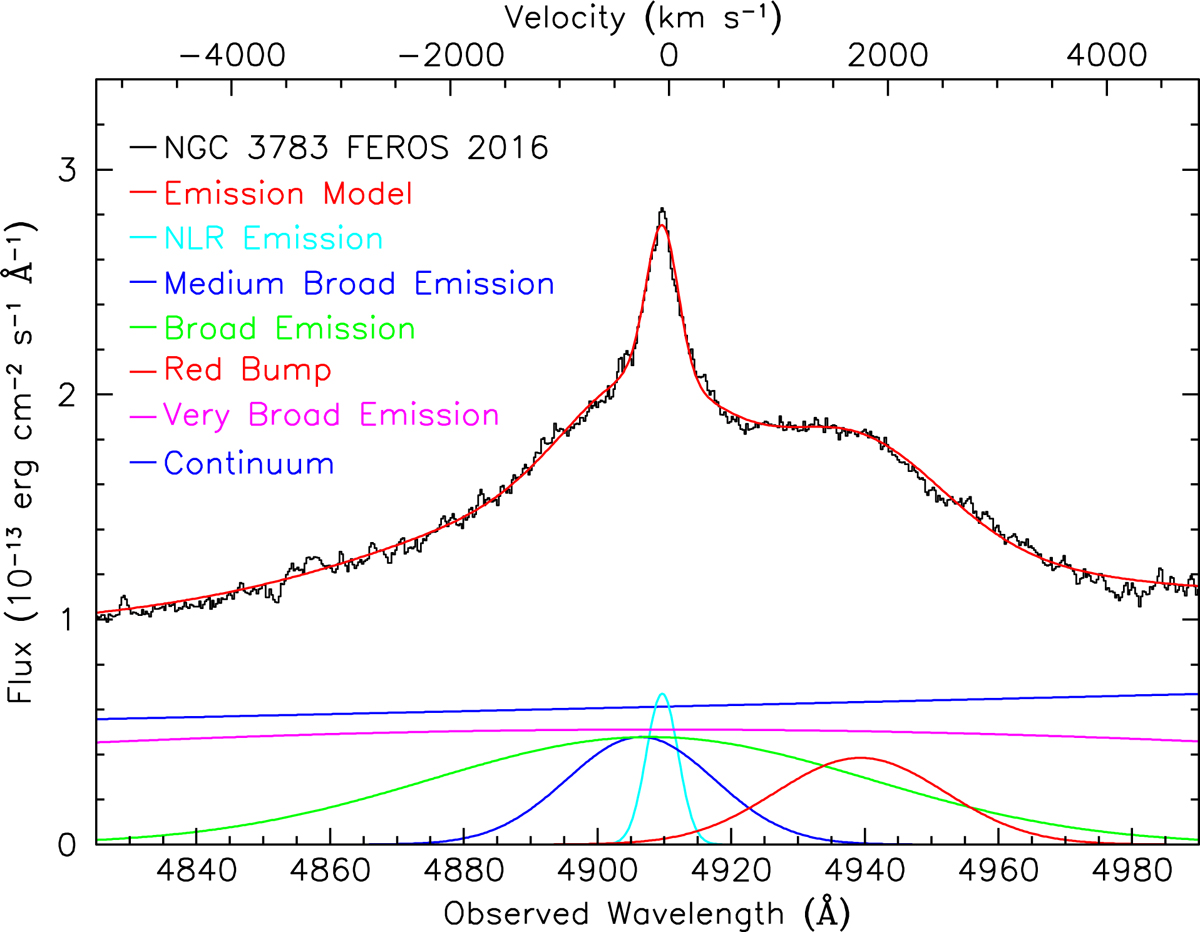
FEROS spectrum of the Hβ region from observations in 2016 December (black histogram). The solid red line tracing the data is the total emission model. The key in the figure identifies the emission components in our model. The velocity scale along the top axis is for the rest wavelength of Hβ relative to the host galaxy systemic redshift, z = 0.00973 (Theureau et al. 1998).
Current usage metrics show cumulative count of Article Views (full-text article views including HTML views, PDF and ePub downloads, according to the available data) and Abstracts Views on Vision4Press platform.
Data correspond to usage on the plateform after 2015. The current usage metrics is available 48-96 hours after online publication and is updated daily on week days.
Initial download of the metrics may take a while.