Fig. 18.
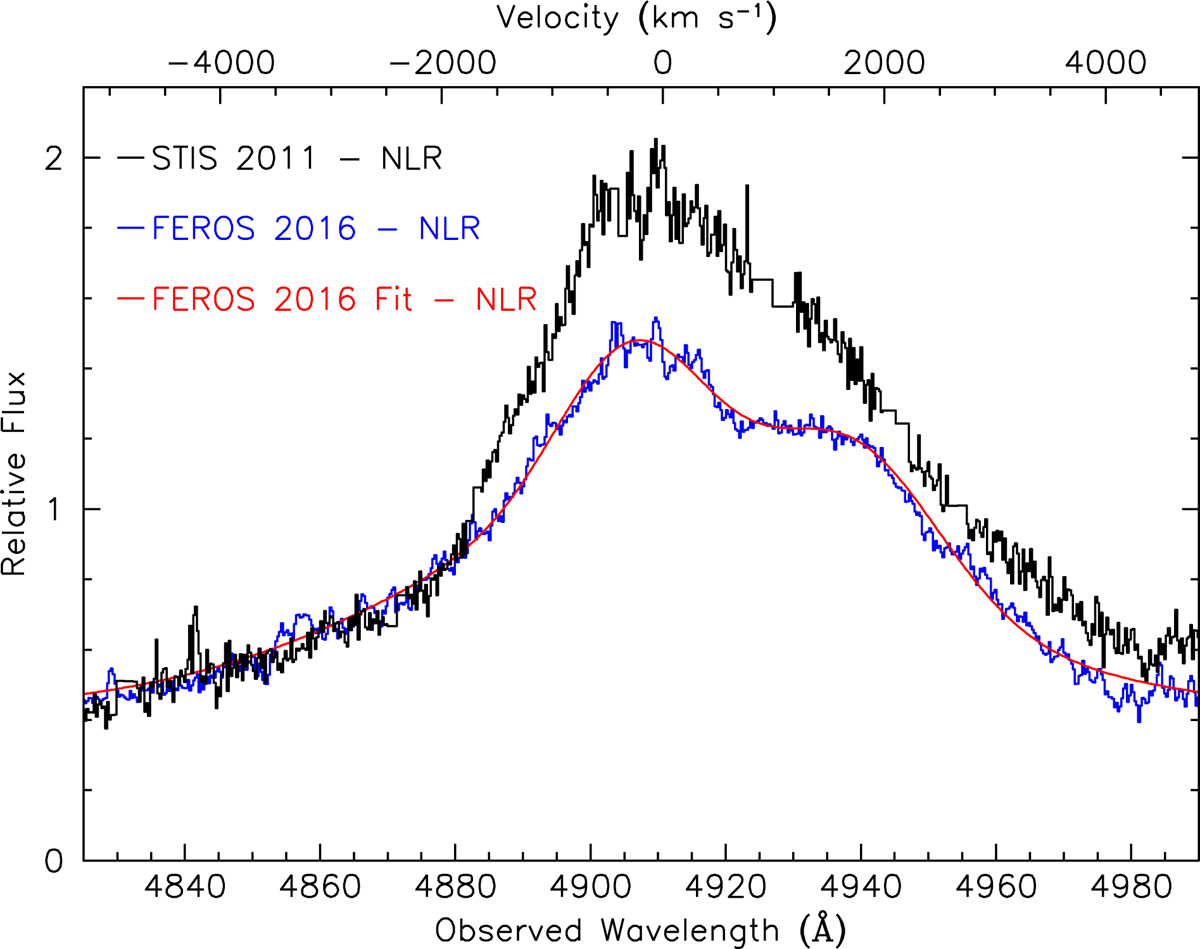
FEROS (blue) and STIS (black) spectra of the Hβ region with the continuum and narrow Hβ emission component subtracted from each. The FEROS spectrum has been scaled to match the STIS spectrum in the far blue wing of the emission line. The solid red line tracing the data shows the total emission model with the continuum and narrow emission component subtracted. The velocity scale along the top axis is for the rest wavelength of Hβ relative to the host galaxy systemic redshift, z = 0.00973 (Theureau et al. 1998).
Current usage metrics show cumulative count of Article Views (full-text article views including HTML views, PDF and ePub downloads, according to the available data) and Abstracts Views on Vision4Press platform.
Data correspond to usage on the plateform after 2015. The current usage metrics is available 48-96 hours after online publication and is updated daily on week days.
Initial download of the metrics may take a while.