Fig. 16.
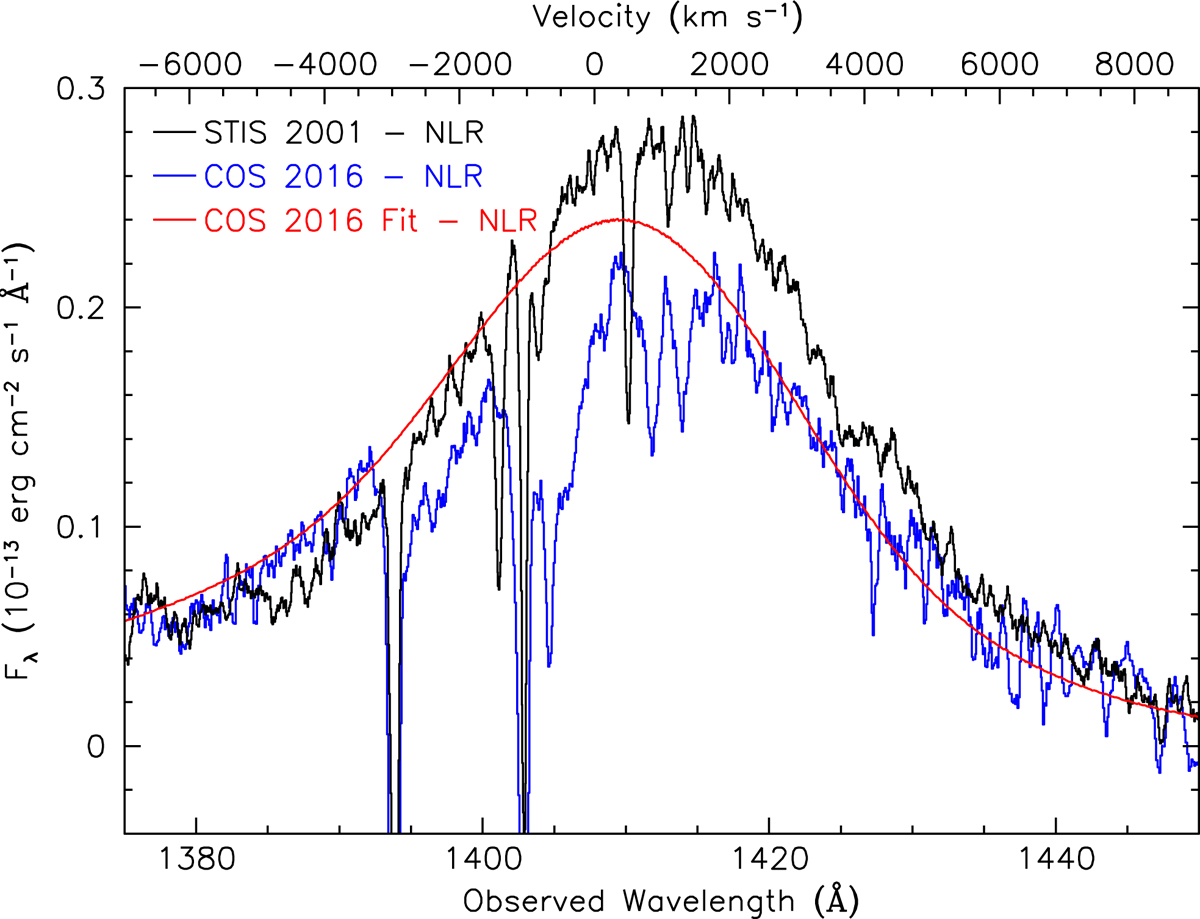
Spectra of the Si IV region as in Fig. 15, but with both the STIS and the COS spectra smoothed by a seven-pixel running boxcar filter. The solid red line is the best-fit emission model for the COS spectrum minus the narrow emission components. The velocity scale along the top axis is for Si IVλ1393.755, relative to the host galaxy systemic redshift, z = 0.00973 (Theureau et al. 1998).
Current usage metrics show cumulative count of Article Views (full-text article views including HTML views, PDF and ePub downloads, according to the available data) and Abstracts Views on Vision4Press platform.
Data correspond to usage on the plateform after 2015. The current usage metrics is available 48-96 hours after online publication and is updated daily on week days.
Initial download of the metrics may take a while.