Fig. 8.
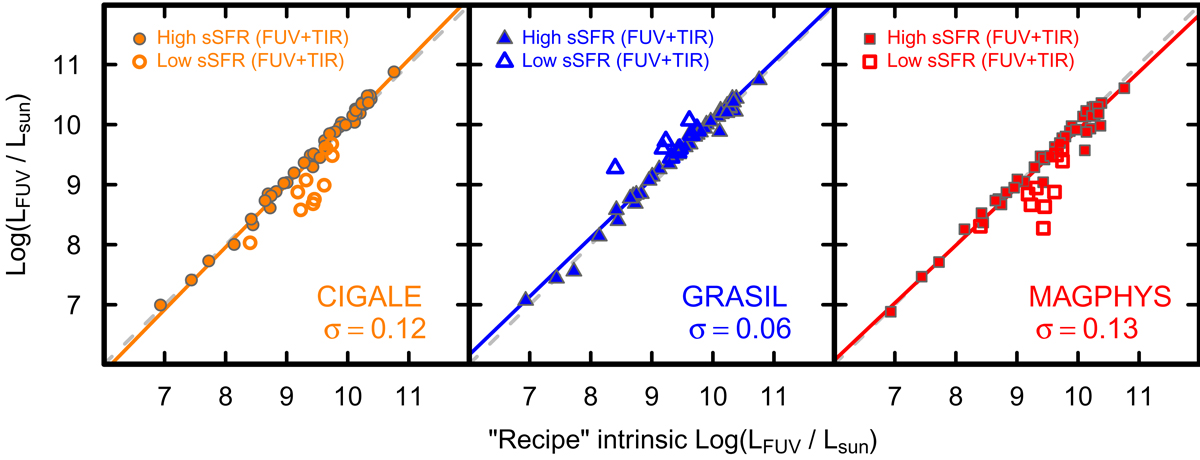
SED-derived LFUV plotted vs. independently determined LFUV with extinction corrections derived from Spitzer and Herschel photometric data (see Sect. 3.3.4 for details). The σ values shown in the lower right corner of each panel correspond to the mean deviations of the LFUV fit (see Table 3). The lines are as in Fig. 4. As in Fig. 5, filled symbols correspond to high specific SFR (Log(sSFR/yr−1) > −10.6), and open ones to low specific SFR (Log(sSFR/yr−1) ≤ −10.6), as noted in the legend in the upper left corners. This sSFR limit corresponds roughly to the lowest quartile in the KINGFISH galaxies, and also to the inflection in the SFMS by Salim et al. (2007).
Current usage metrics show cumulative count of Article Views (full-text article views including HTML views, PDF and ePub downloads, according to the available data) and Abstracts Views on Vision4Press platform.
Data correspond to usage on the plateform after 2015. The current usage metrics is available 48-96 hours after online publication and is updated daily on week days.
Initial download of the metrics may take a while.