Fig. 5.
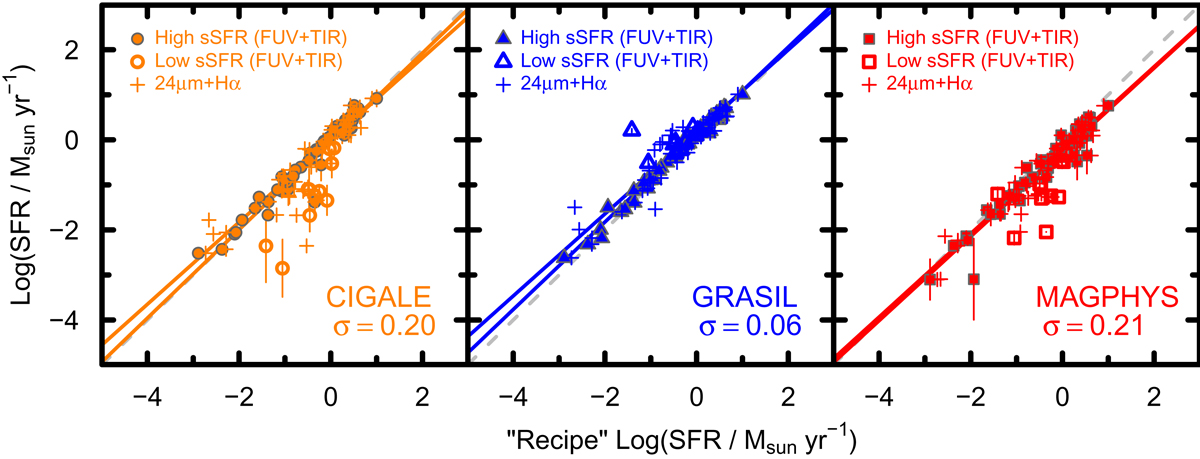
SED-derived SFR plotted vs. independently determined recipe SFR (see Sect. 3.3.2 for details). Two different SFR tracers are shown: FUV+TIR and Hα+24μm luminosity; see Appendix B for details. Symbols (dark-orange circles for CIGALE, blue triangles for GRASIL, and red squares for MAGPHYS) are calculated with SFR(FUV+TIR); plus signs show the recipe SFR(Hα+24μm) luminosity. Filled symbols correspond to “high” specific SFR (Log(sSFR/yr−1) > −10.6), and open ones to “low” specific SFR (Log(sSFR/yr−1) ≤ −10.6, calculated with SFR(FUV+TIR). The robust correlations are shown as solid lines, and the identity relation by a (gray) dashed one; in each panel, the steeper power-law slope corresponds to the fit to SFR(FUV+TIR) and the shallower one to SFR(Hα+24μm) (see Table 3 for details). The rms deviations for the fit of SED-derived quantities vs. the reference ones (for SFR(FUV+TIR)) are shown by the σ value in the lower right corner of each panel; similarly, SED-fitting uncertainties are shown as vertical lines only for SFR(FUV+TIR) x values. rms deviations for SFR(Hα+24μm) are 0.25 dex, 0.18 dex, and 0.26 dex for CIGALE, GRASIL, and MAGPHYS, respectively (see Table 3).
Current usage metrics show cumulative count of Article Views (full-text article views including HTML views, PDF and ePub downloads, according to the available data) and Abstracts Views on Vision4Press platform.
Data correspond to usage on the plateform after 2015. The current usage metrics is available 48-96 hours after online publication and is updated daily on week days.
Initial download of the metrics may take a while.