Fig. 4.
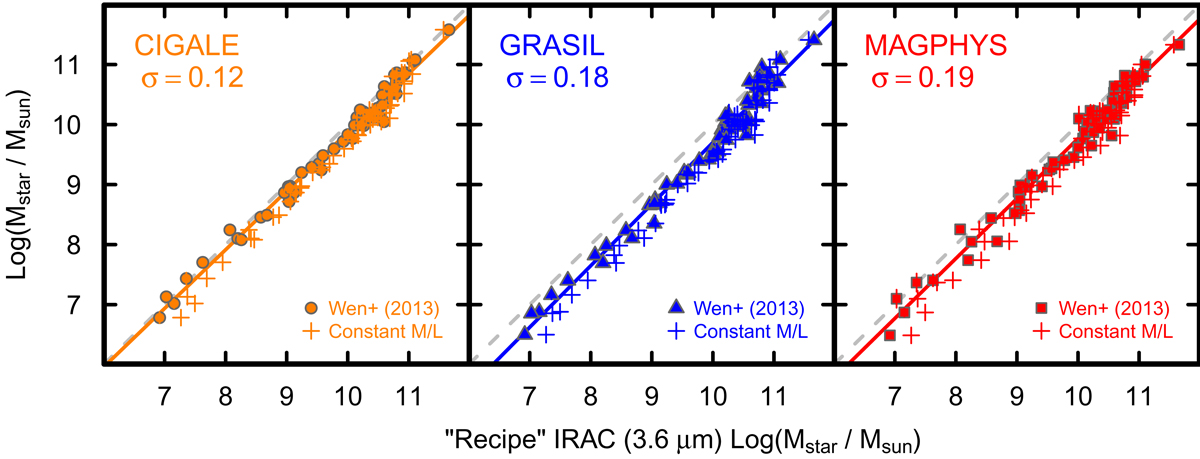
SED-derived Mstar plotted vs. independently determined Mstar from the recipe IRAC 3.6 μm luminosities (see Sect. 3.3.1 for details). The Wen et al. (2013) Mstar values are shown by filled (dark-orange) circles (CIGALE), filled (blue) triangles (GRASIL), and filled (red) squares (MAGPHYS), and the constant M/L ones by +; the σ values shown in the upper left corner of each panel correspond to the mean deviations from the fit of Mstar with the Wen et al. (2013) method (see Table 3). Similarly, SED-fitting uncertainties are shown as vertical lines only for the Wen et al. (2013)x values, and are usually smaller than the symbol size. The robust correlation relative to the Wen et al. (2013) values is shown as a solid line, and the identity relation by a (gray) dashed one.
Current usage metrics show cumulative count of Article Views (full-text article views including HTML views, PDF and ePub downloads, according to the available data) and Abstracts Views on Vision4Press platform.
Data correspond to usage on the plateform after 2015. The current usage metrics is available 48-96 hours after online publication and is updated daily on week days.
Initial download of the metrics may take a while.