Fig. A.1.
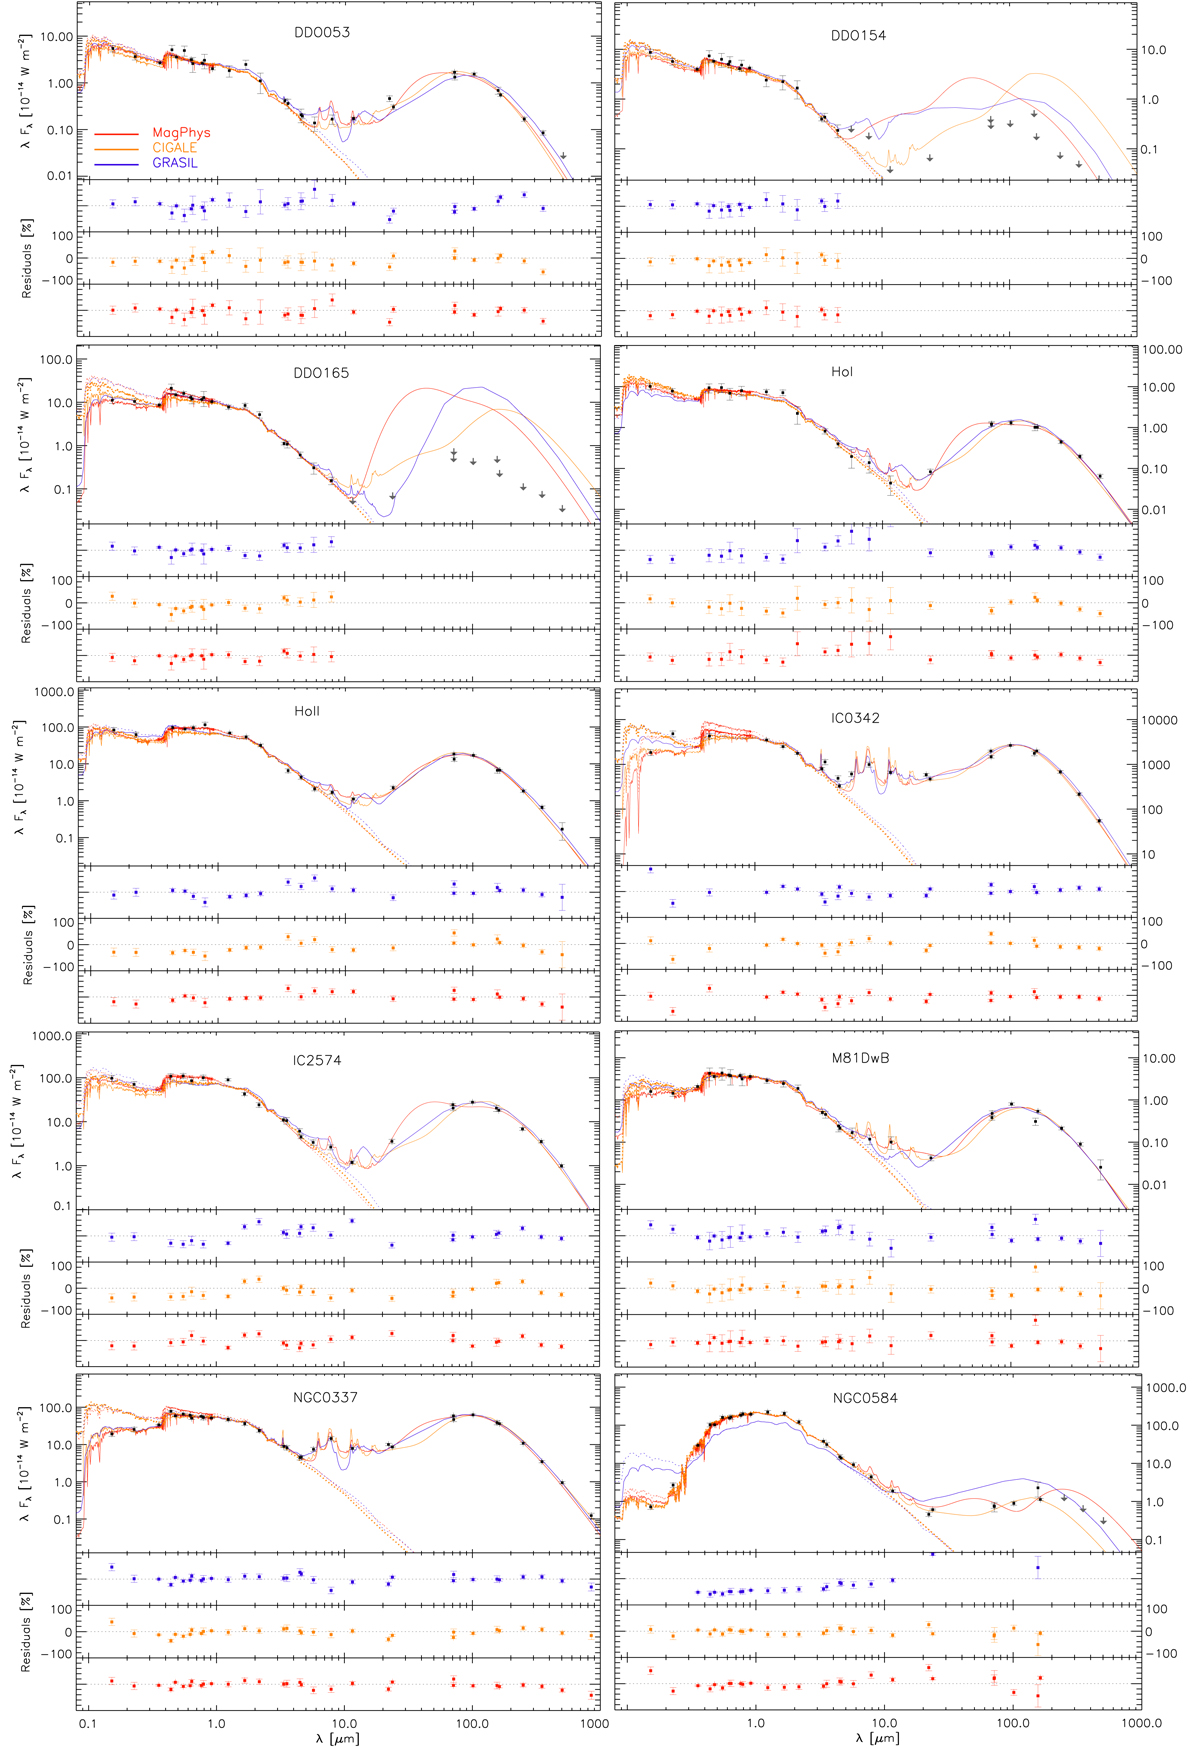
Panchromatic SEDs for the KINGFISH galaxies based on the photometry measurements from Dale et al. (2017) overlaid with the best-fitting SED models inferred from the SED fitting tools MAGPHYS (red curve), CIGALE (dark-orange curve) and GRASIL (blue curve). The dashed curves represent the (unattenuated) intrinsic model emission for each SED fitting method (using the same color coding). The bottom part of each panel shows the residuals for each of these models compared to the observed fluxes in each waveband. Gray arrows points show the upper limits when available.
Current usage metrics show cumulative count of Article Views (full-text article views including HTML views, PDF and ePub downloads, according to the available data) and Abstracts Views on Vision4Press platform.
Data correspond to usage on the plateform after 2015. The current usage metrics is available 48-96 hours after online publication and is updated daily on week days.
Initial download of the metrics may take a while.