Fig. 21.
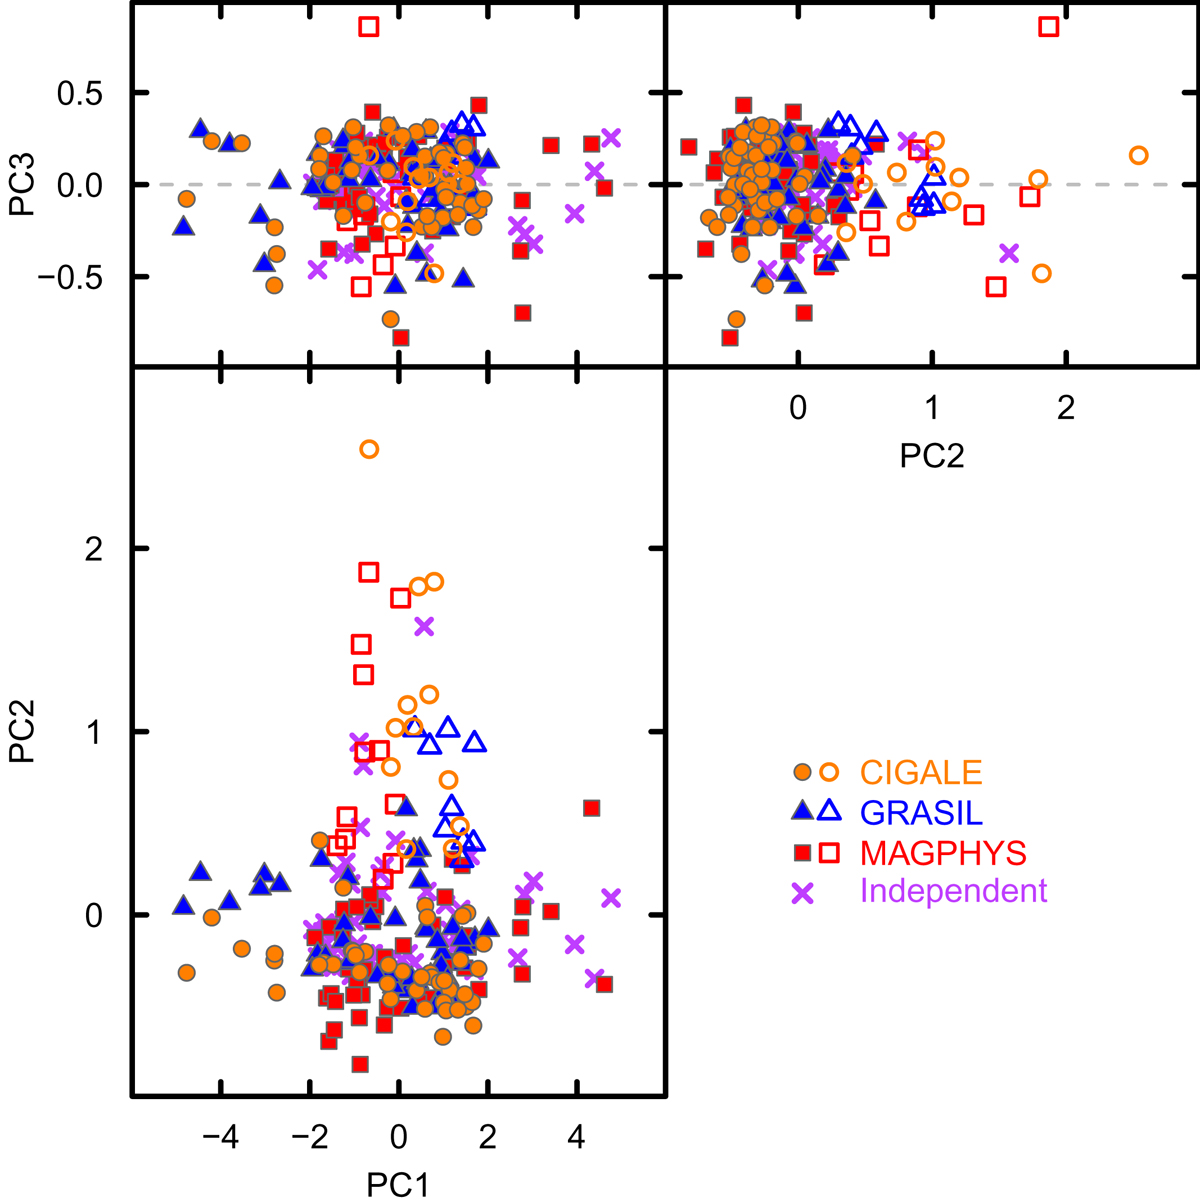
Different projections of the plane defined by Log(Mstar), Log(SFR), and Log(Mdust) for KINGFISH galaxies: the edge-on projection is given in the top panels and the face-on in the bottom. As in previous figures, open symbols correspond to galaxies with low sSFR [Log(sSFR/yr−1) ≤ −10.6], and filled symbols to high sSFR [Log(sSFR/yr−1) > −10.6]. With x1 = log(Mdust)−⟨log(Mdust/M⊙)⟩; x2 = log(SFR)−⟨log(SFR/M⊙ yr−1)⟩; x3 = log(Mstar)−⟨log(Mstar/M⊙)⟩; and for CIGALE mean values ⟨log(Mdust/M⊙)⟩ = 6.93; ⟨log(SFR/M⊙ yr−1)⟩ = − 0.44; ⟨log(Mstar/M⊙)⟩ = 9.76; we find PC1 = 0.65 x1 + 0.48 x2 + 0.59 x3; PC2 = 0.01 x1 − 0.80 x2 + 0.60 x3; PC3 = 0.76 x1 − 0.37 x2 − 0.54 x3. The PCAs for the different SED-fitting algorithms are similar.
Current usage metrics show cumulative count of Article Views (full-text article views including HTML views, PDF and ePub downloads, according to the available data) and Abstracts Views on Vision4Press platform.
Data correspond to usage on the plateform after 2015. The current usage metrics is available 48-96 hours after online publication and is updated daily on week days.
Initial download of the metrics may take a while.