Fig. 20.
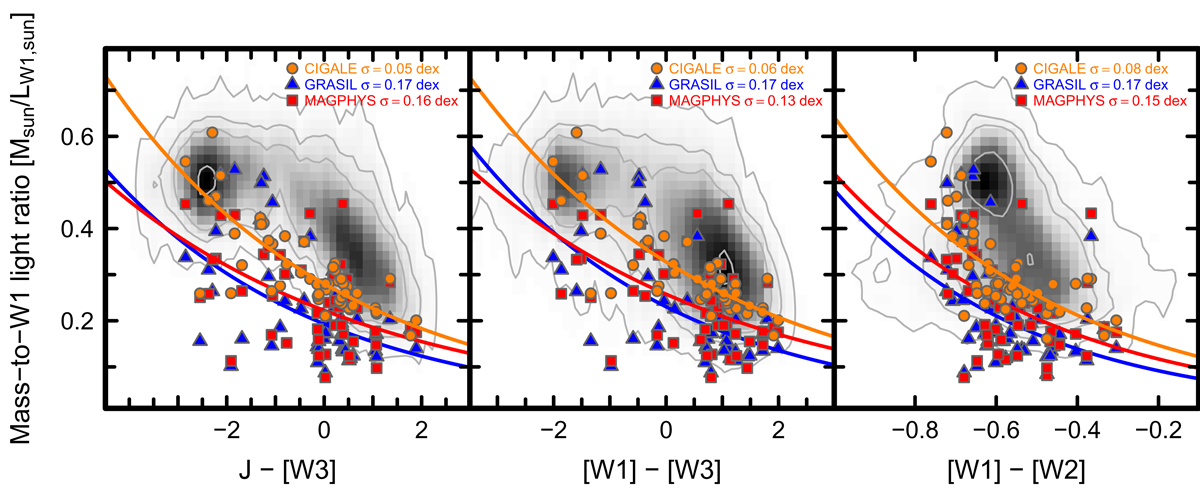
Mass-to-light ratios in the WISE W1 band of KINGFISH galaxies plotted vs. the J−[W3] color (left panel); [W1]−[W3] (middle); and [W1]−[W2] (right). As in Fig. 19, the underlying gray scale corresponds to the GSWLC data (Salim et al. 2016). Legends in the upper right corners give the rms deviation of the robust best fits, shown as curves in each panel, of the M/L(W1) ratios vs. and colors. The best fit rms of 0.05 dex (for CIGALE) is obtained for M/L as a function of J-[W3] (left panel), but [W1]−[W3] is only 0.01 dex worse (for CIGALE, see middle panel). The fit of M/L with [W1]–[W2] (right panel) is the worst of all three colors shown here, but only by 0.03 dex (for CIGALE, comparable for the other two algorithms). All magnitudes are on the AB system.
Current usage metrics show cumulative count of Article Views (full-text article views including HTML views, PDF and ePub downloads, according to the available data) and Abstracts Views on Vision4Press platform.
Data correspond to usage on the plateform after 2015. The current usage metrics is available 48-96 hours after online publication and is updated daily on week days.
Initial download of the metrics may take a while.