Fig. 19.
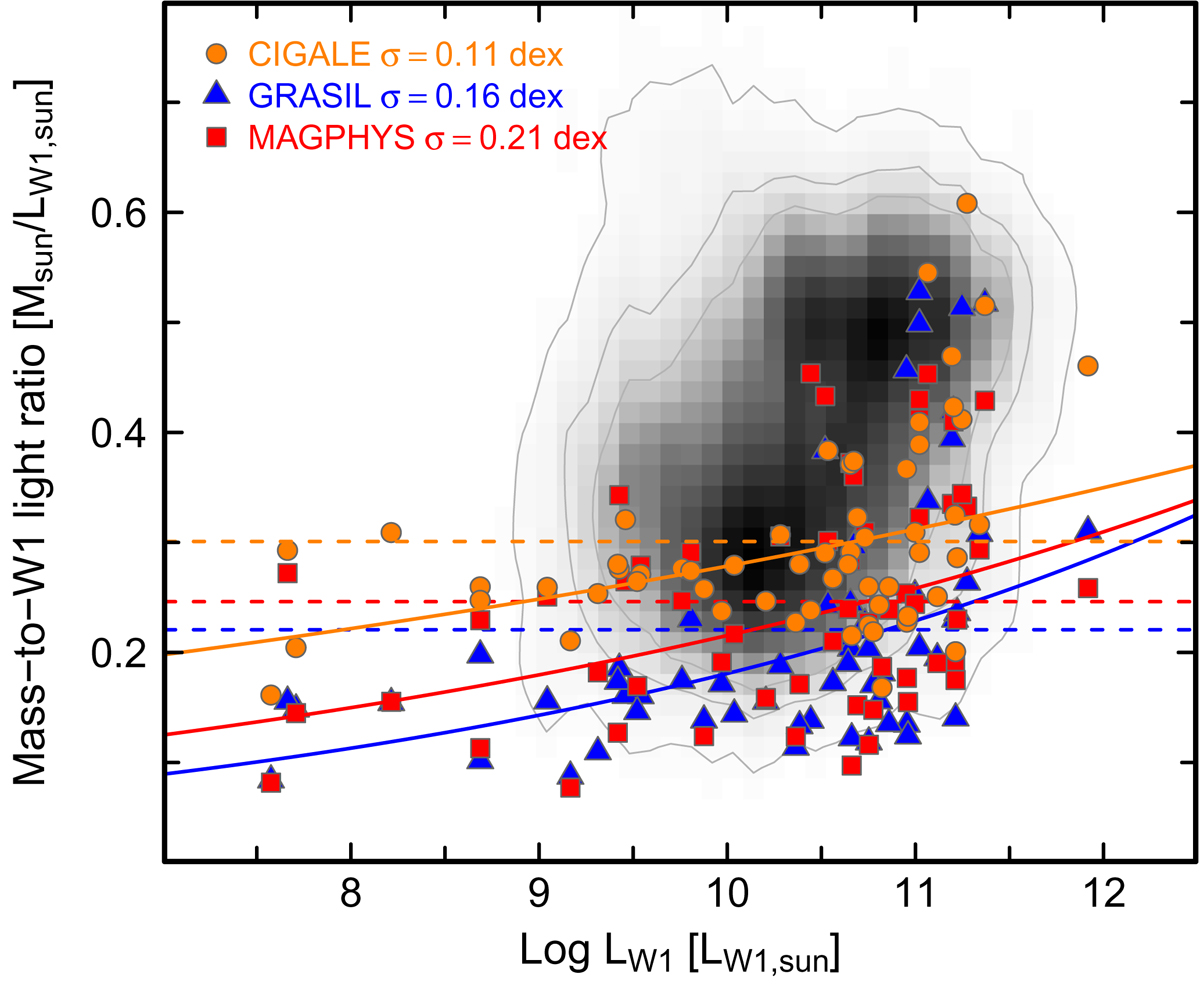
SED-derived stellar masses with observed WISE W1 luminosities for mass-to-W1 light ratios plotted against observed W1 luminosity; the underlying gray scale gives the GSWLC sample from Salim et al. (2016, see text for details). Squares (orange) show CIGALE Mstar values, triangles (blue) GRASIL, and circles (red) MAGPHYS. The robust regressions for each SED-fitting algorithm are shown as solid curves, and the σ values are given in the upper left corner. The horizontal dashed lines show the mean of ΥW1 for Mstar values from the three fitting codes: 0.30 (CIGALE), 0.22 (GRASIL), and 0.25 (MAGPHYS).
Current usage metrics show cumulative count of Article Views (full-text article views including HTML views, PDF and ePub downloads, according to the available data) and Abstracts Views on Vision4Press platform.
Data correspond to usage on the plateform after 2015. The current usage metrics is available 48-96 hours after online publication and is updated daily on week days.
Initial download of the metrics may take a while.