Fig. 17.
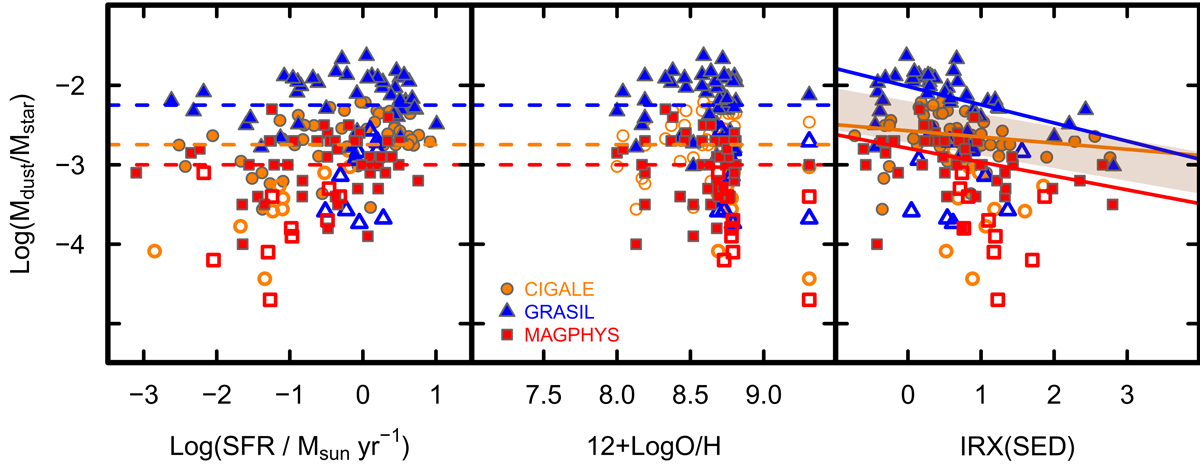
SED-derived Mdust/Mstar ratios in logarithmic space plotted against (SED-derived) SFR, 12+log(O/H), and (SED-derived) IRX. The middle panel shows the PP04N2 calibration for 12+log(O/H) as described in the text. The dashed horizontal lines in the left and middle panels show the means of Log(Mdust/Mstar) for each SED-fitting algorithm (dark orange: CIGALE; blue: GRASIL; red: MAGPHYS). The fits of (Log) Mdust/Mstar vs. IRX for the individual SED algorithms are shown as colored solid lines in the right panel; the gray region gives the ±1σ interval around the mean of the three individual regressions. As in previous figures, open symbols correspond to galaxies with low sSFR [Log(sSFR/yr−1) ≤ −10.6], and filled symbols to high sSFR [Log(sSFR/yr−1) > −10.6].
Current usage metrics show cumulative count of Article Views (full-text article views including HTML views, PDF and ePub downloads, according to the available data) and Abstracts Views on Vision4Press platform.
Data correspond to usage on the plateform after 2015. The current usage metrics is available 48-96 hours after online publication and is updated daily on week days.
Initial download of the metrics may take a while.