Fig. 15.
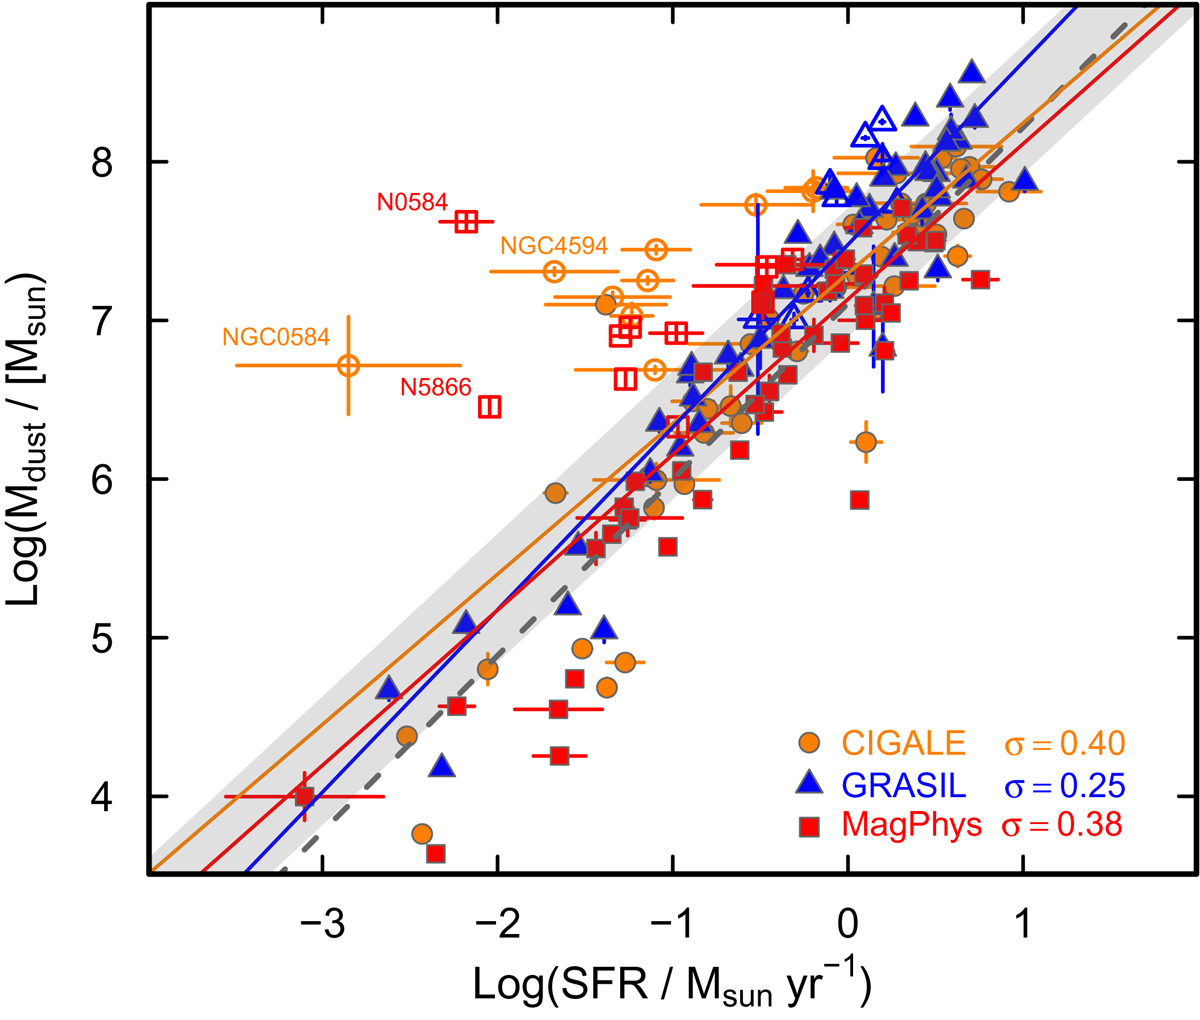
SED-derived Mdust vs. SFR in logarithmic space. The σ values of the best-fit robust correlations are shown in the lower right corner, and the robust regressions for each SED-fitting algorithm are shown as solid lines. The (gray) dashed one corresponds to the relation given by da Cunha et al. (2010) for SDSS galaxies. The gray area illustrates the ±1σ range around the mean slope: here σ corresponds to the mean rms of the three individual fits, and the mean slope to the mean of the three individual slopes. As in previous figures, filled symbols correspond to high specific SFR (Log(sSFR/yr−1 > −10.6), and open ones to low specific SFR (Log(sSFR/yr−1) ≤ −10.6).
Current usage metrics show cumulative count of Article Views (full-text article views including HTML views, PDF and ePub downloads, according to the available data) and Abstracts Views on Vision4Press platform.
Data correspond to usage on the plateform after 2015. The current usage metrics is available 48-96 hours after online publication and is updated daily on week days.
Initial download of the metrics may take a while.