Fig. 14.
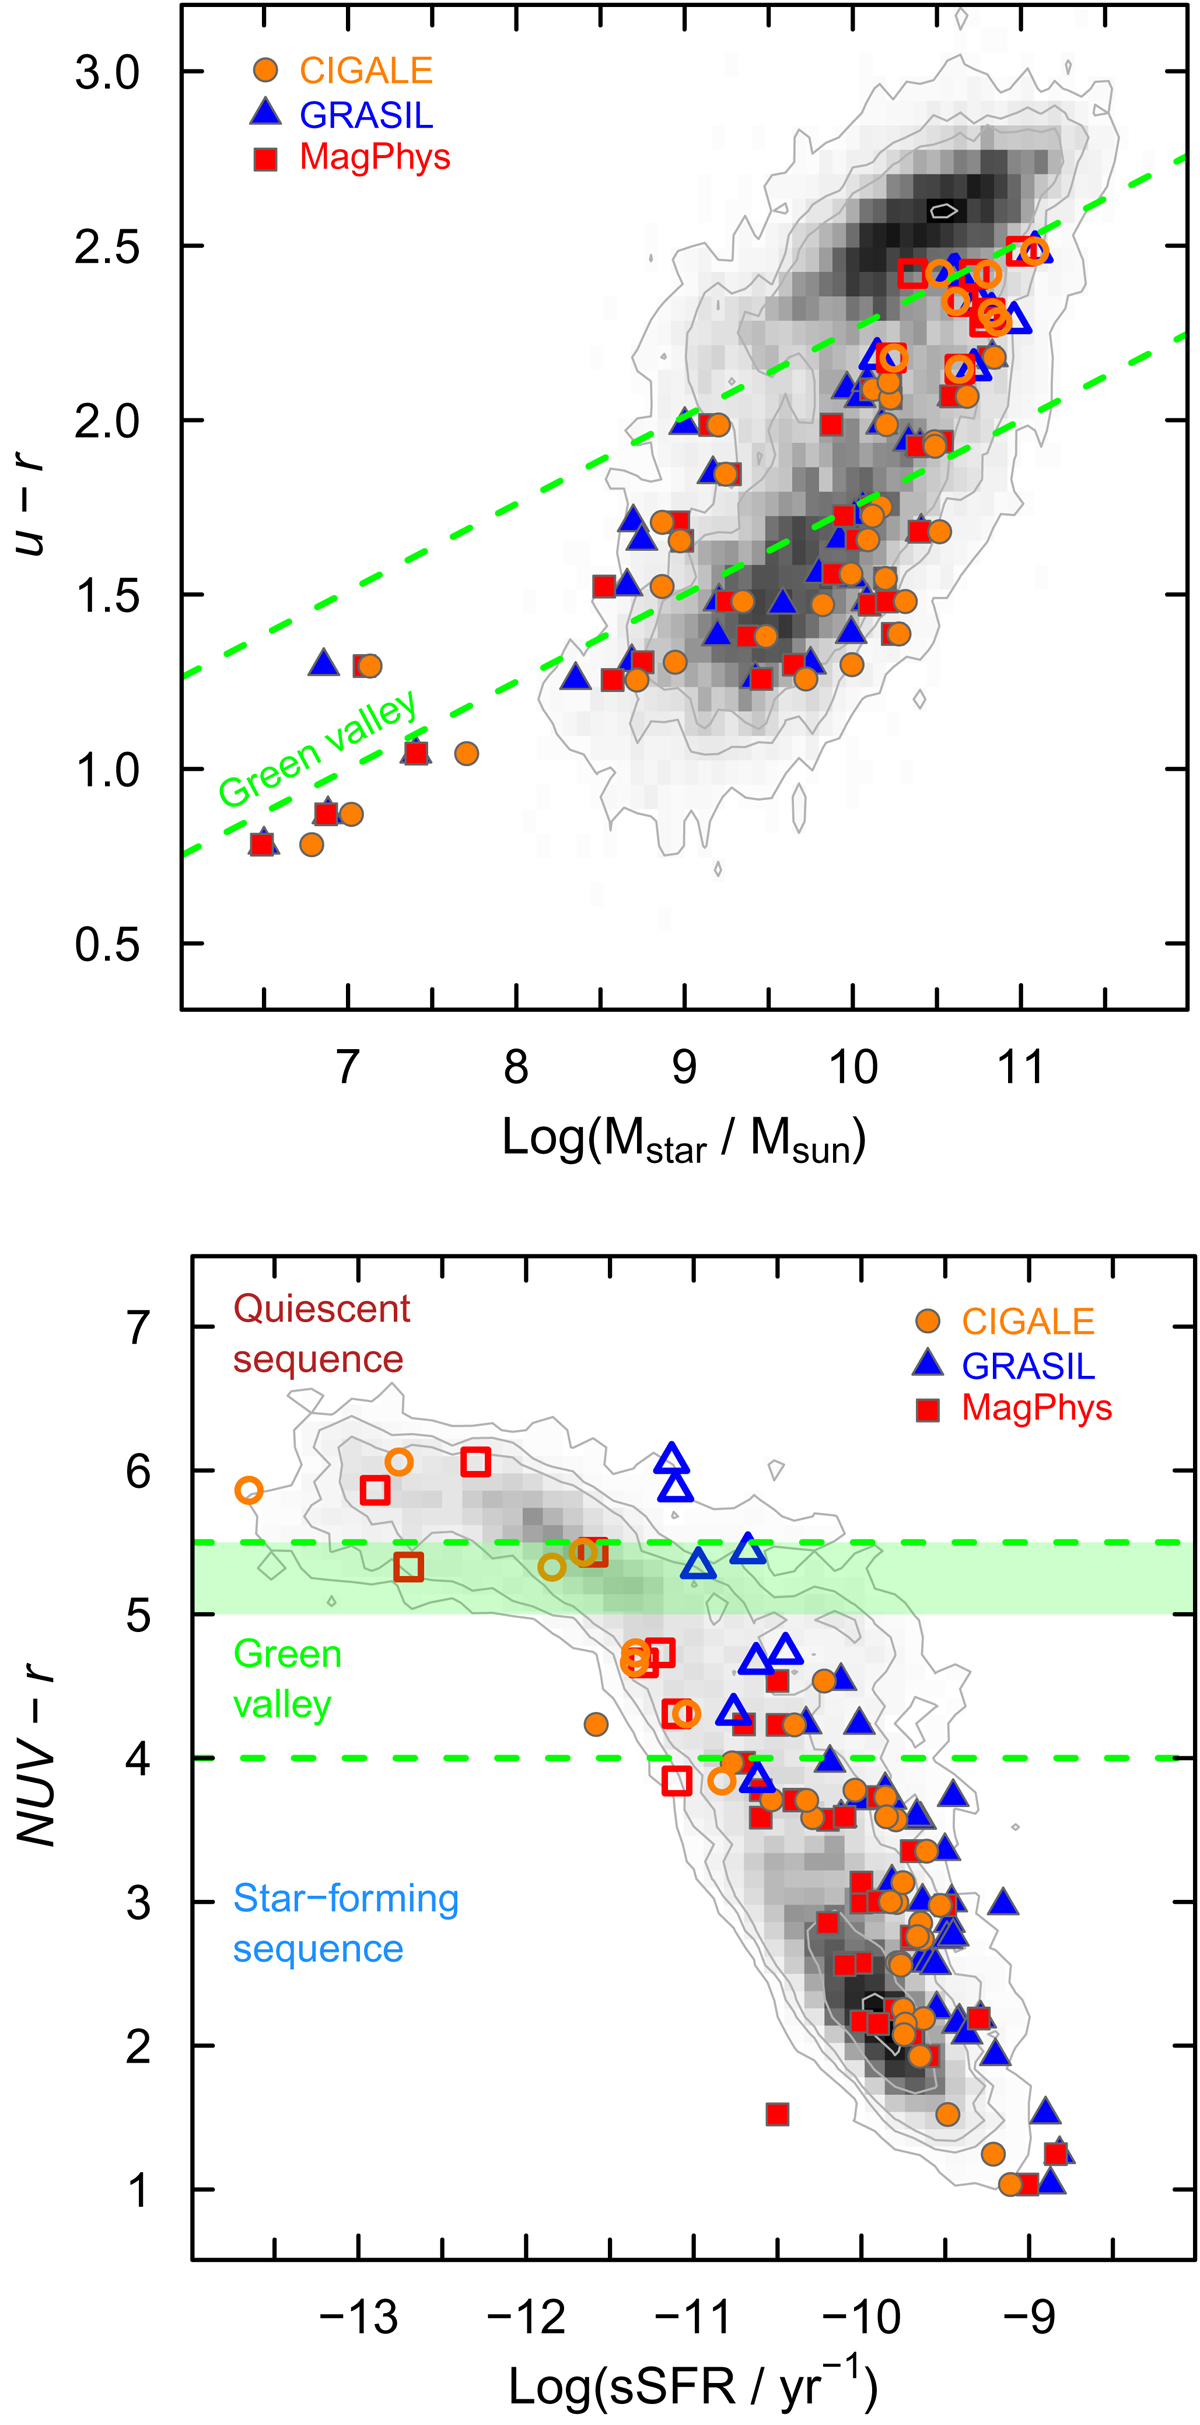
Colors of KINGFISH galaxies plotted against the logarithm of stellar mass given by the respective SED-fitting algorithms (top panel) and the SED-derived logarithm of sSFR (bottom, with units of yr−1); the top panel shows SDSS u − r, and the bottom NUV−r. In both panels, the KINGFISH galaxies are superimposed on the GSWLC sample, taking only those galaxies with 0.015 ≤ z ≤ 0.06. As in previous figures, filled symbols correspond to high specific SFR (Log(sSFR/yr−1) > −10.6), and open ones to low specific SFR (Log(sSFR/yr−1) ≤ −10.6). In the top panel, the (green) dashed lines correspond to the separation of the “green valley” from the upper (red) and lower (blue) loci of SDSS galaxies as given by Schawinski et al. (2014). In the bottom, we have included the NUV−r color range for the “green valley” transition proposed by Salim (2014), together with the limit for ETG SF activity of NUV−r = 5.5 given by Kaviraj et al. (2007). The green shaded area marks the (uncertain) boundary between star-forming and quiescent ETGs.
Current usage metrics show cumulative count of Article Views (full-text article views including HTML views, PDF and ePub downloads, according to the available data) and Abstracts Views on Vision4Press platform.
Data correspond to usage on the plateform after 2015. The current usage metrics is available 48-96 hours after online publication and is updated daily on week days.
Initial download of the metrics may take a while.