Fig. 13.
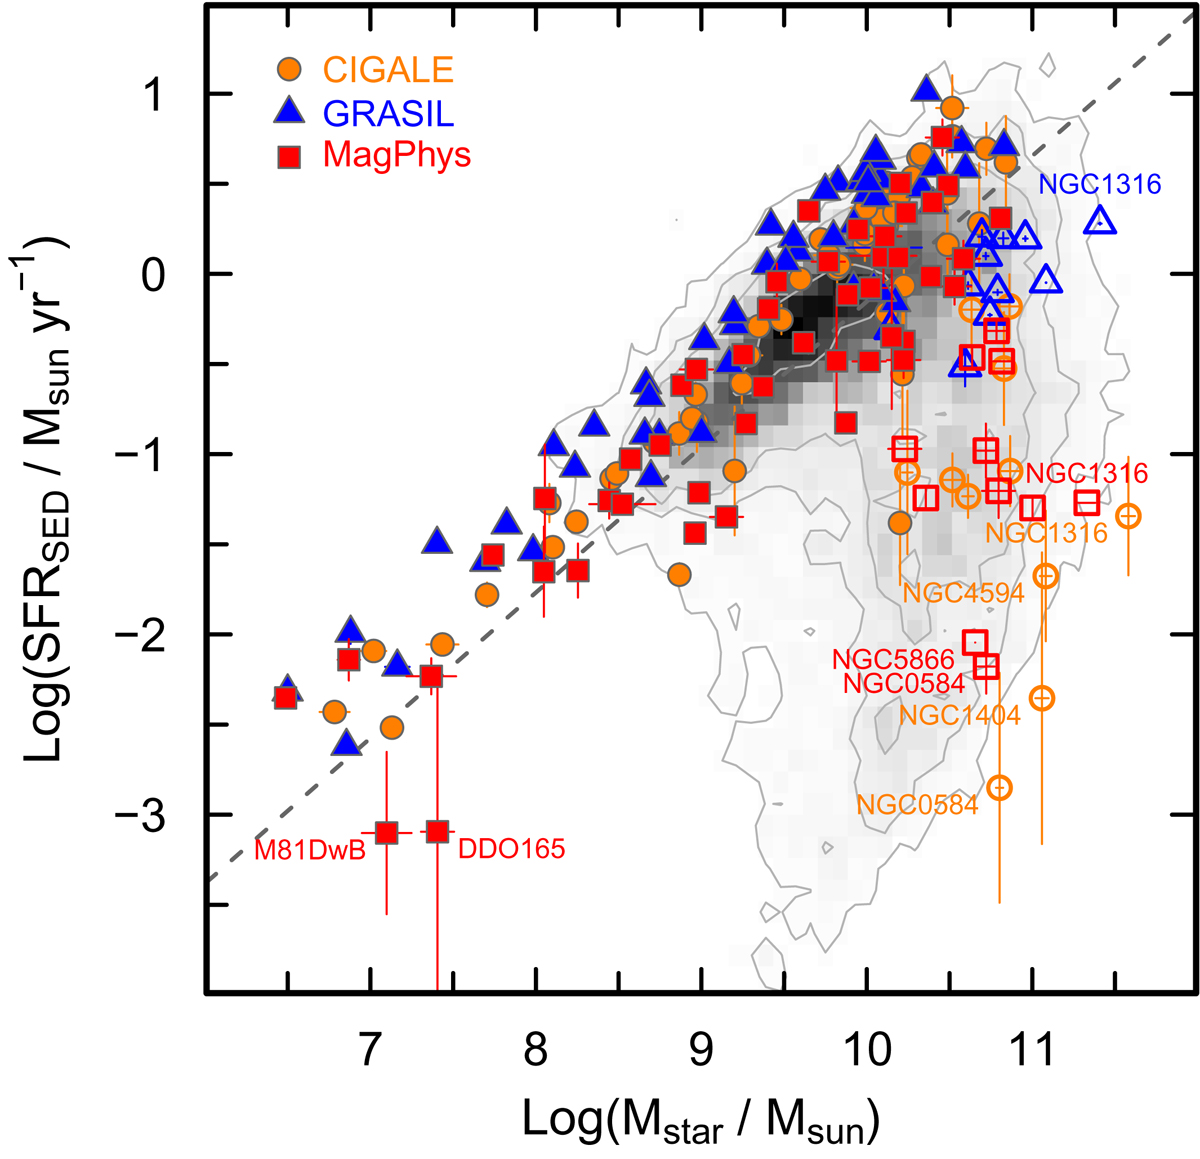
SED-derived SFR vs. Mstar in logarithmic space superimposed on the GSWLC sample shown in gray-scale from Salim et al. (2016, see text for details). As in previous figures, filled symbols correspond to high specific SFR (Log(sSFR/yr−1) > −10.6), and open ones to low specific SFR (Log(sSFR/yr−1) ≤ −10.6). The (gray) dashed line corresponds to the SFMS relation found by Hunt et al. (2016) for nearby galaxies.
Current usage metrics show cumulative count of Article Views (full-text article views including HTML views, PDF and ePub downloads, according to the available data) and Abstracts Views on Vision4Press platform.
Data correspond to usage on the plateform after 2015. The current usage metrics is available 48-96 hours after online publication and is updated daily on week days.
Initial download of the metrics may take a while.