Fig. 12.
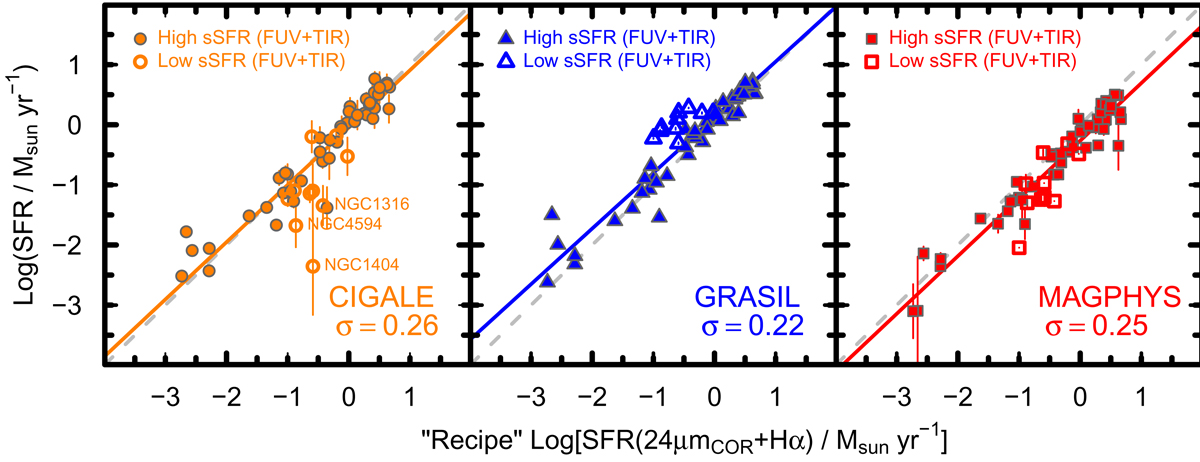
SED-derived SFR plotted vs. SFRs determined from L24 μm, cor + LHα. As in previous figures, filled symbols correspond to high specific SFR, and open ones to low specific SFR (as calculated with SFR(FUV+TIR)). This figure is the same as Fig. 5, but here the SFRs from Hα+24 μm luminosities have been corrected as described in the text. The regression lines are as in Fig. 5; the mean deviations for the fit of SED-derived quantities vs. the recipe (for SFR(L24 μm, cor + LHα)) are shown by the σ value in the lower right corner of each panel.
Current usage metrics show cumulative count of Article Views (full-text article views including HTML views, PDF and ePub downloads, according to the available data) and Abstracts Views on Vision4Press platform.
Data correspond to usage on the plateform after 2015. The current usage metrics is available 48-96 hours after online publication and is updated daily on week days.
Initial download of the metrics may take a while.