Fig. 10.
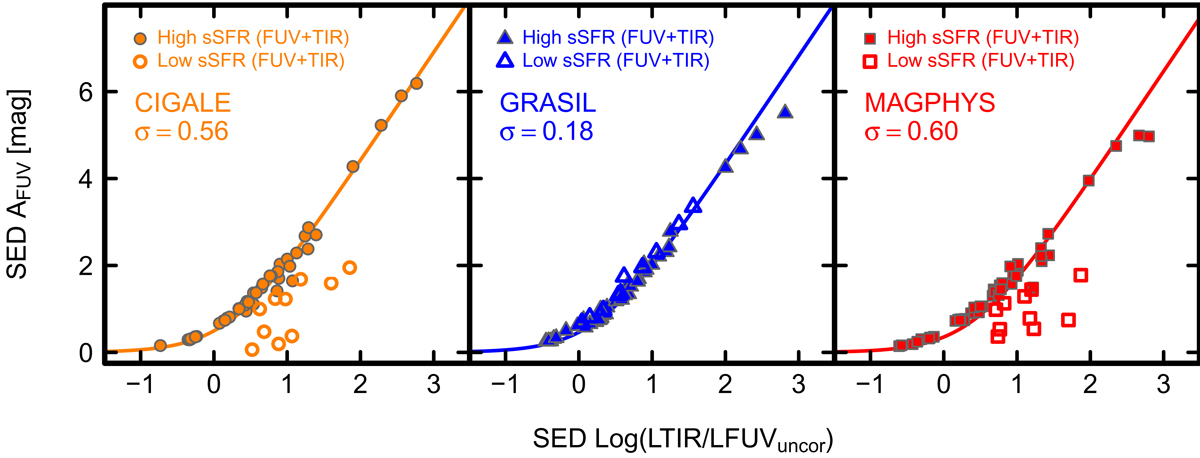
SED-derived AFUV plotted against SED-derived IRX [log10(LTIR/LFUV)]. The solid curve shows the fit obtained by adopting the formulation in Eq. (7); as described in the text, the best-fitting aFUV values are estimated using only the galaxies with (Log(sSFR/yr−1) > −10.6). The mean deviations comparing the SED-derived AFUV and the fitted ones from SED-derived IRX (now including all galaxies) are shown by the σ value in each panel. As in previous figures, filled symbols correspond to high specific SFR (Log(sSFR/yr−1) > −10.6), and open ones to low specific SFR (Log(sSFR/yr−1) ≤ −10.6), as noted in the legend in the upper left corners.
Current usage metrics show cumulative count of Article Views (full-text article views including HTML views, PDF and ePub downloads, according to the available data) and Abstracts Views on Vision4Press platform.
Data correspond to usage on the plateform after 2015. The current usage metrics is available 48-96 hours after online publication and is updated daily on week days.
Initial download of the metrics may take a while.