Fig. 6.
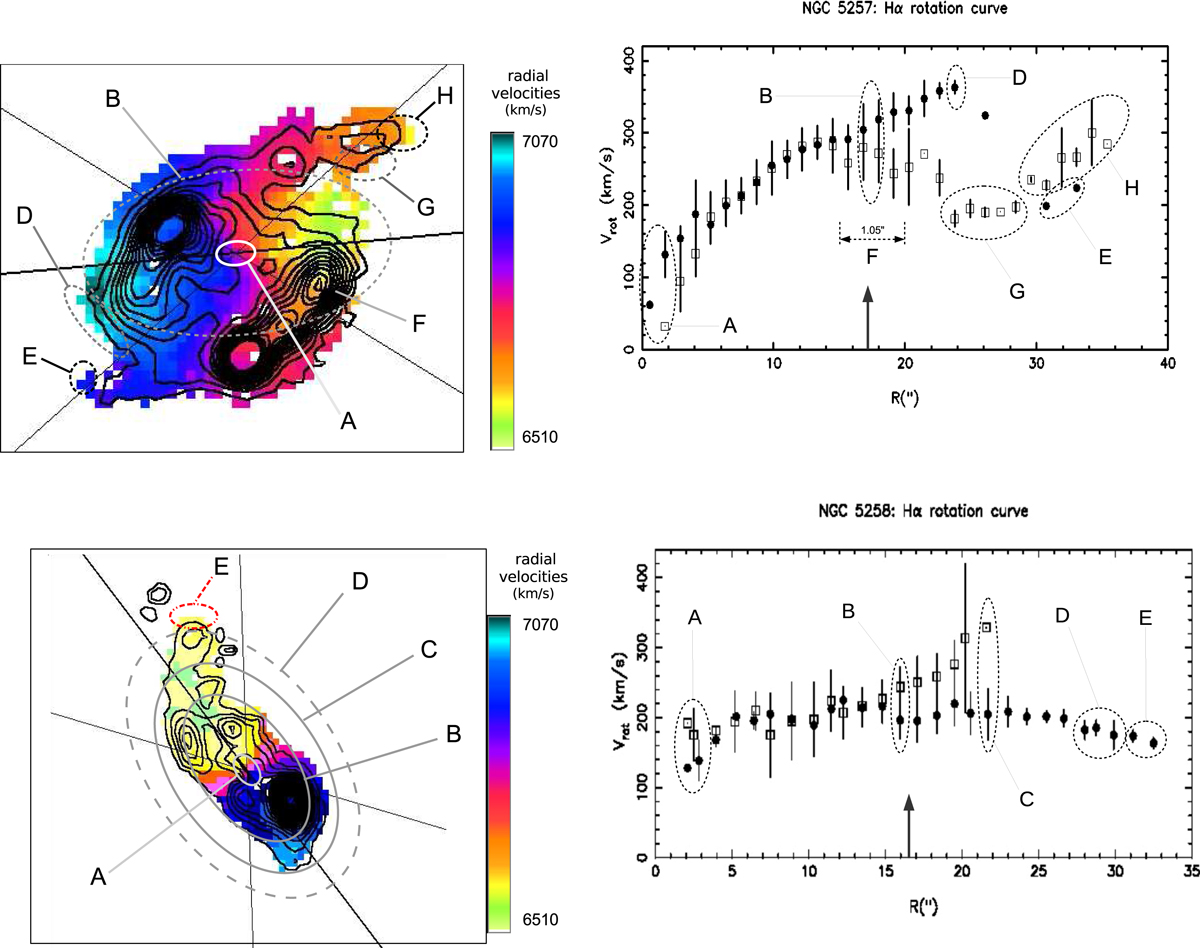
Top left panel: velocity field of NGC 5257 with monochromatic isophotes. Letters indicate features associated with variations in the rotation curve of the galaxy. Solid line indicates the galaxy’s position angle (PA), the slash-dotted lines indicate the angular sector from both sides of the major axis considered for the computation of the galaxy’s RC. Top right panel: rotation curve (RC) of NGC5257 derived from scanning Fabry-Perot (FP) observations of the ionized gas. Dark circles represent velocities on the receding side of the galaxy; light squares indicate velocities on the approaching side of the galaxy. The regions and letters shown are associated with features in the rotation curve of the galaxy. These are discussed in Sect. 4.5. Bottom left panel: same as top left panel for NGC 5258. Bottom right panel: RC of NGC 5258. Dark circles represent velocities on the approaching side of the galaxy; light squares indicate velocities on the receding side of the galaxy.
Current usage metrics show cumulative count of Article Views (full-text article views including HTML views, PDF and ePub downloads, according to the available data) and Abstracts Views on Vision4Press platform.
Data correspond to usage on the plateform after 2015. The current usage metrics is available 48-96 hours after online publication and is updated daily on week days.
Initial download of the metrics may take a while.