Fig. 4.
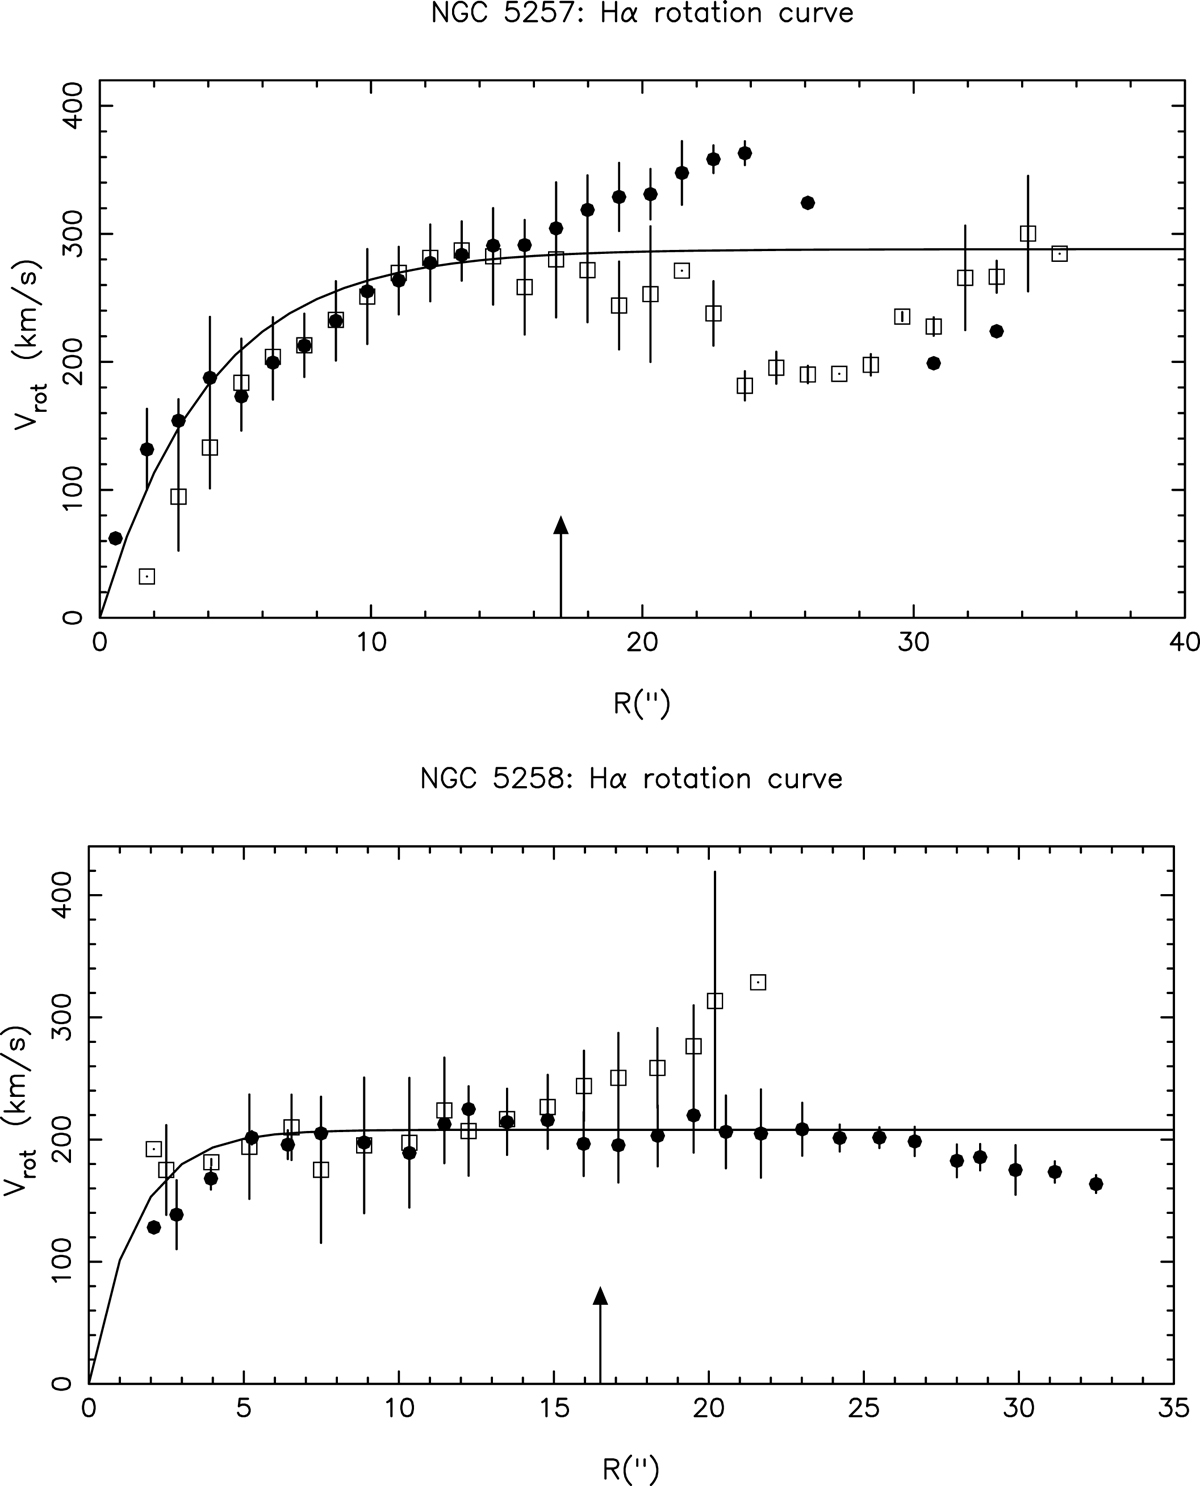
Top panel: rotation curve (RC) of NGC 5257 derived from scanning Fabry–Perot (FP) observations of the ionized gas. Dark circles represent velocities on the receding side of the galaxy; light squares indicate velocities on the approaching side of the galaxy. Bottom panel: RC of NGC 5258. Dark circles represent velocities on the receding side of the galaxy; light squares indicate velocities on the approaching side of the galaxy. Solid lines show the parametric fit of each RC discussed in Sect. 4.4.2. Arrows indicate the position of Rbif discussed in Sect. 4.3.
Current usage metrics show cumulative count of Article Views (full-text article views including HTML views, PDF and ePub downloads, according to the available data) and Abstracts Views on Vision4Press platform.
Data correspond to usage on the plateform after 2015. The current usage metrics is available 48-96 hours after online publication and is updated daily on week days.
Initial download of the metrics may take a while.