Fig. 10.
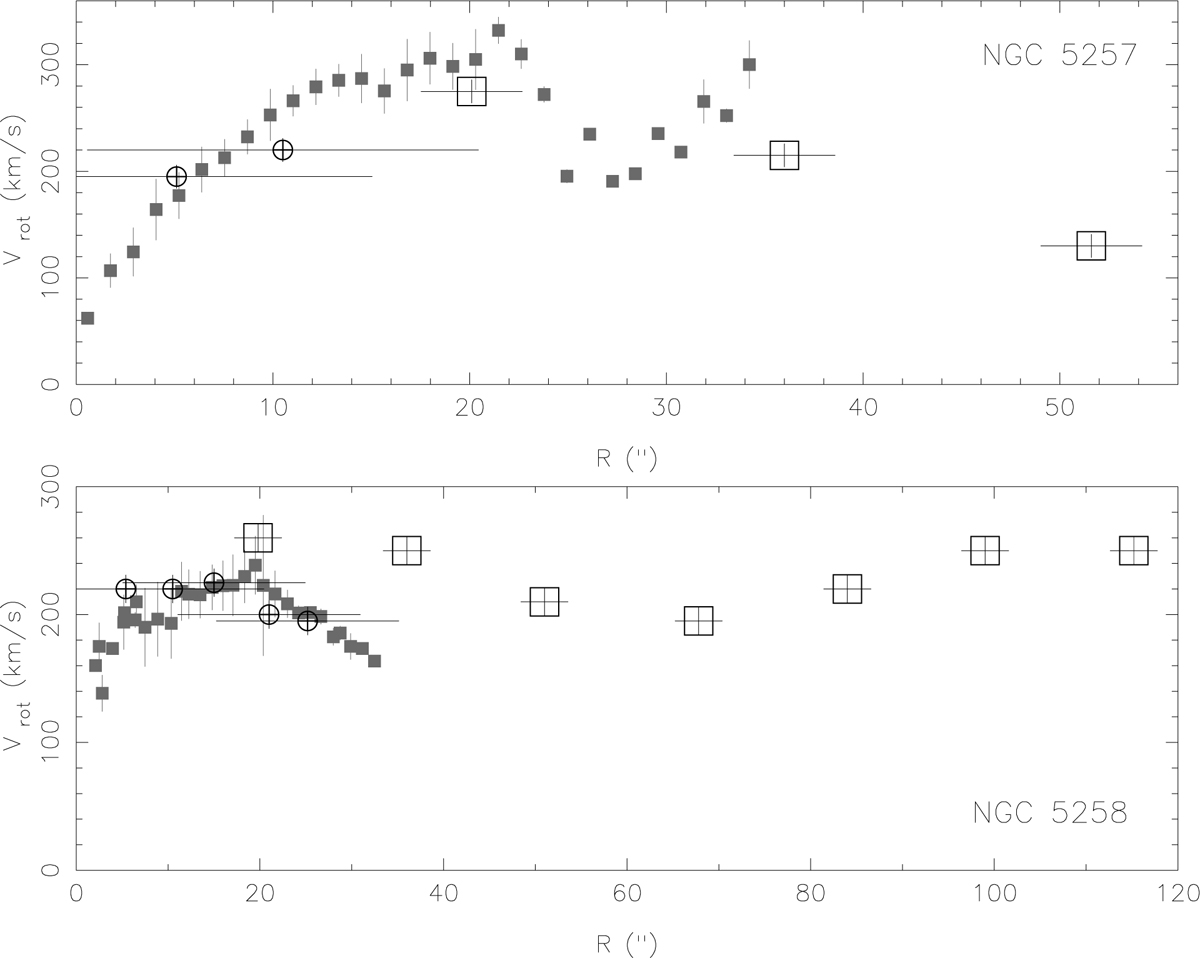
Multi-wavelength rotation curves of NGC 5257 (top panel) and NGC 5258 (bottom panel) displaying all observed points. Small squares in the inner parts of the curve correspond to optical Fabry–Perot Hα observations. Empty circles in the inner parts correspond to the CO(1-0) curve derived by Iono et al. (2005). Empty squares in the outer parts correspond to the HI curve also derived by Iono et al. (2005).
Current usage metrics show cumulative count of Article Views (full-text article views including HTML views, PDF and ePub downloads, according to the available data) and Abstracts Views on Vision4Press platform.
Data correspond to usage on the plateform after 2015. The current usage metrics is available 48-96 hours after online publication and is updated daily on week days.
Initial download of the metrics may take a while.