Fig. 7.
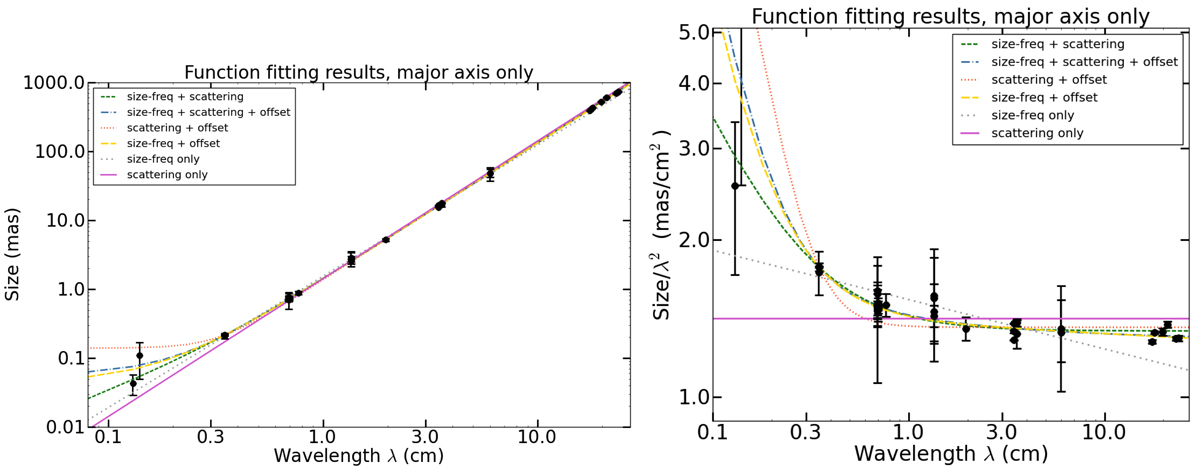
Left panel: aggregate measurement data for the observed major axis size of Sgr A∗ (black points with error bars), and model fitting results for different combinations of included model components (coloured lines). The highest-quality fits are provided by the green, blue and orange lines (the top 3 listed in the legend) which provide very similar fit qualities (see Table 4). Right panel: same data, plotted with the major axis sizes divided by wavelength squared. The fitting results without the 230 GHz data are almost identical to these, and hence are not plotted separately.
Current usage metrics show cumulative count of Article Views (full-text article views including HTML views, PDF and ePub downloads, according to the available data) and Abstracts Views on Vision4Press platform.
Data correspond to usage on the plateform after 2015. The current usage metrics is available 48-96 hours after online publication and is updated daily on week days.
Initial download of the metrics may take a while.