Fig. 2.
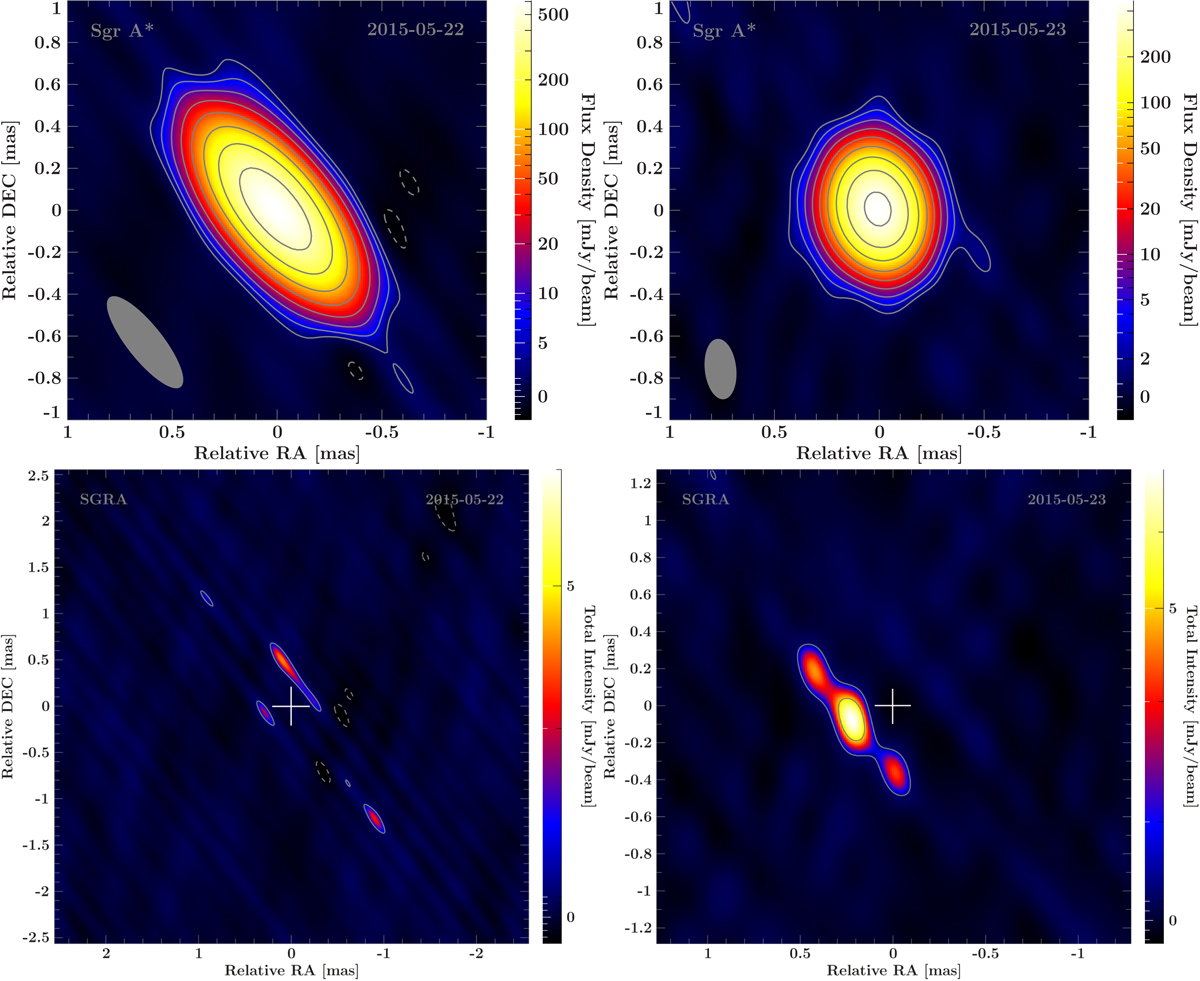
Results of hybrid mapping of Sgr A∗ at 3 mm. Top left panel: beam-convolved image from the dataset of project BF114A (2015-05-22) using VLBA and LMT. Top right panel: beam-convolved image from the dataset of project BF114B (2015-05-23) using VLBA, LMT and GBT. The contours indicate the flux density level (dashed-grey contours are negative), scaled logarithmically and separated by a factor of two, with the lowest level set to the 3σ-noise level. Bottom left panel: residual map of Sgr A∗ after primary component subtraction from the BF114A dataset, using natural weighting. No clear pattern is seen in the residual image. Bottom right panel: natural-weighted residual map for Sgr A∗, epoch B, after subtraction of the best-fitting 2D Gaussian source component. The remaining excess flux towards the east is highly concentrated and clearly present. Both residual images use a cross to indicate the centre of the primary (subtracted) component on the sky. Image and model parameters are listed in Tables 1 and 2, respectively.
Current usage metrics show cumulative count of Article Views (full-text article views including HTML views, PDF and ePub downloads, according to the available data) and Abstracts Views on Vision4Press platform.
Data correspond to usage on the plateform after 2015. The current usage metrics is available 48-96 hours after online publication and is updated daily on week days.
Initial download of the metrics may take a while.